Fri, 13-Mar 2026

Search news articles
  • Home
  • AllAgricultureBankingAviationEnergyManufacturingTechnologyStartups
  • Geopolitics
  • Kenya Business NewsAfrican Business NewsGlobal News
  • Press Releases
  • Shows
  • Best Places to Work 2026
Subscribe
Events
Subscribe
  • Home
  • AllAgricultureBankingAviationEnergyManufacturingTechnologyStartups
  • Geopolitics

    Contact Us

    Media Queries & Partnerships:[email protected]

    About Us

    We are a leading integrated digital content platform providing in-depth business and financial news across Sub-Saharan Africa & the globe.

    Disclaimer

    The information contained in this website is for general information purposes only.
    © 2026 Wallstreet Africa Technologies LTD.. All Rights Reserved.
    1.0.32

    NSE 20 Share Index slips below 3000, Sh 136 Billion Lost in 11 Days

    The Kenyan
    By The Kenyan Wall Street
    - January 15, 2017
    - January 15, 2017
    Kenya Business news
    NSE 20 Share Index slips below 3000, Sh 136 Billion Lost in 11 Days

    The benchmark NSE 20 share Index on Friday January 13, 2017 lost 168.11 points (5.36%) to close at 2971.10, levels last seen in Sept 2009. All share Index (NASI) ended the week 4.49% lower to stand at 123.94.

    The market’s decline extends massive losses from last year when the NSE 20 index and NASI tumbled by 21% and 8% respectively as per our 2016 Market Report. The benchmark is heading toward the lows witnessed in early 2009, just after the height of the 2008 financial crisis.

    Since the start of 2017 (the last 11 trading days), NSE Kenya market capitalization has declined by approximately Ksh 136.5 billion to settle at Ksh 1.795 trillion compared to Ksh. 1.932 trillion recorded in the last trading day of 2016.

    Banking Sector 

    Stanbic Bank Kenya closed the week at a three year low of ksh. 65.50 from the highs of Ksh 130 traded in March 2015.

    Housing Finance (HF Group), Equity Bank and Diamond Trust Bank (DTB) both fell to levels last seen four years ago on Friday to close at Ksh 11.85, Ksh. 25.75 and Ksh. 117 respectively. Equity and DTB counters have shed by more than 30% over the last one year while HF Group has shed 44.19% over the same period.

    Kenya Commercial Bank (KCB Group) closed the week at Ksh. 26.50 which is -34.57% on a 12 month basis.

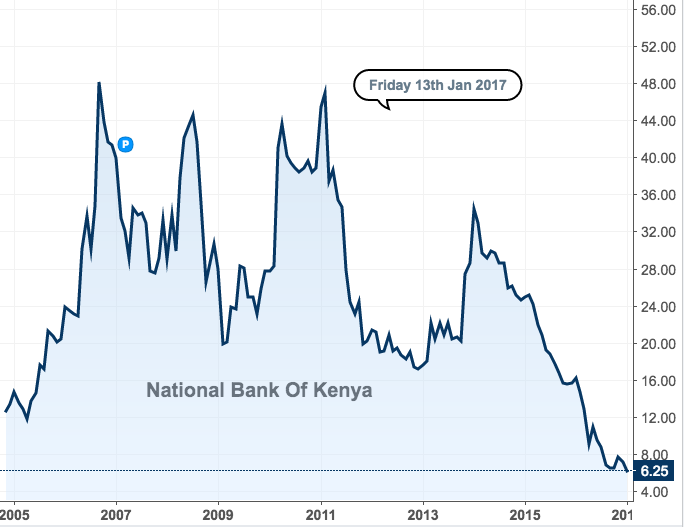
    On this sector, National Bank of Kenya has been the worst hit having lost more than 60% of its value over the 12 month period. The counter on Friday closed at a 13 year low of Ksh. 6.45.  The huge drop on this counter is partly attributed to negative corporate governance issues facing the lender.
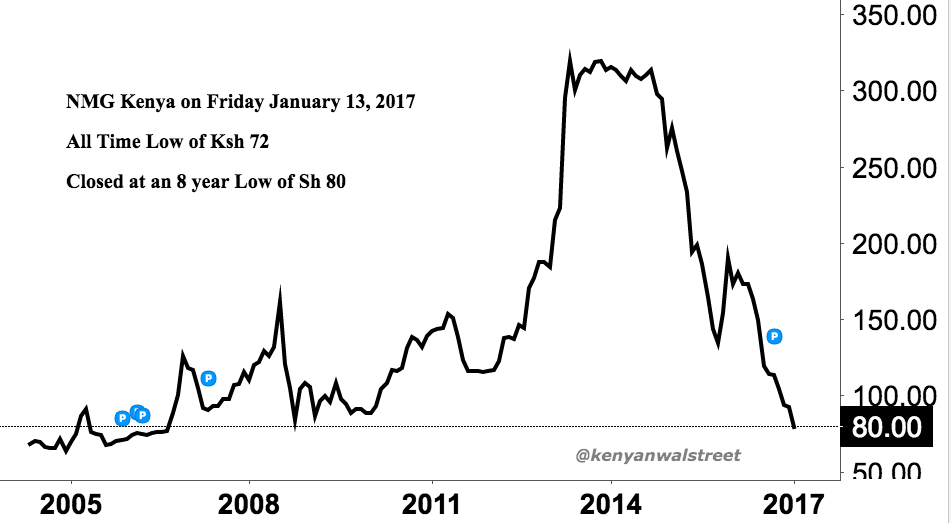
The Kenyan Wallstreet

    Nation Media Group

    Meanwhile, Nation Media Group share Price touched an all time low of Ksh 72 during Friday’s trading session and closed at at an 8 year low of Ksh 80 as shown in the chart below.

    The Kenyan Wallstreet
    Nation Media Group Chart

    The Kenyan Wall Street

    We are a leading integrated digital content platform providing in-depth business and financial news across Africa & the globeSubscribe
    Loading...
    Loading...
    Loading...
    Loading...
    Loading...
    Loading...
    Loading...
    Loading...
    Loading...
    Loading...
    Loading...
    Loading...
    Loading...
    Loading...
    Loading...
    Loading...
    Loading...
    Loading...
    Loading...
    Loading...

    Your edge in markets, powered by AI

    Explore cutting-edge insights with our AI assistant, delivering real-time analysis, personalized news, and in-depth answers at your fingertips.

    Sign Up

    Show me today’s top trades

    Explain the market in simple terms

    What’s my next smart move?

    Report Issue

    Wall Street Africa Business Intelligence

    Access exclusive news, expert analysis, and tools designed to give investors an edge.

    Fixed Income

    Real-time bond pricing with instant calculations, auction data, yield curves, and trend analysis for Africa’s fixed-income markets.

    Local and Global Insights

    Unique perspective with a blend of local and global news and analysis, tailored for African investors.

    Real-Time Economic Indicators

    Monitor inflation, currency movements, and other key economic indicators for African countries.

    Interactive Data for Local Markets

    Visualize trends and compare markets across Africa with interactive charts and tools.
    Wallstreet Africa
    Wallstreet Africa
    Wallstreet Africa