
“The market can remain irrational longer than you can remain solvent.” – John Maynard Keynes
We have come to the very end of a painful year in the markets. Most Sub Saharan equity markets have done poorly from a dollar return perspective apart from a few, notably Namibia whose main index has returned well over 30% in dollar terms. Here in Kenya the All share index has lost 8 percentage points to close the year at 133.34 points.
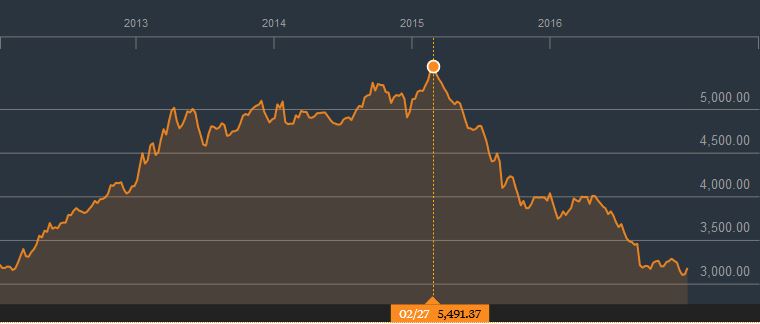
The benchmark NSE 20 Index, a composition of Kenyan blue chip companies was down by a startling 21 percent to close the year at 3,186.21 points. In fact only eleven counters emerged on the green and most of the remaining counters were down by double digit percentage points. From a two year horizon most of the counters have more than halved in value since the peak in 2015.
Contrarians may view this as another opportunity to build positions however one needs real conviction to go against the market. Most commentators saw that 2016 was going to have a trend reversal (including us) but it continued exacerbating and trending down further, Jesse Livermore the boy plunger puts it best by saying ‘you can’t fight the tape!’
| Equity Trading Stats 2016 | |
| No. of Deals | 300,454 |
| Total Year Volume | 5,813,492,239 |
| Total Year Value (Kshs) | 147,178,325,246 |
| Mkt Cap (Ksh Billions) | 1,931.607 |
| Mkt Cap( US $) (Millions) | 18.848 |
| Main Market P/E | 13.74 |
Gainers of the Year
| Company | 31 Dec. 2015 Price | 30 Dec. 2016 Price | % Gain | Shares Traded | |
| 1. | Nairobi Business Ventures *Listed in June at 5.00 | 5.00 | 7.90 | +58.00 | 454,000 |
| 2. | Kenol Kobil | 9.60 | 14.90 | +55.21 | 244,004,773 |
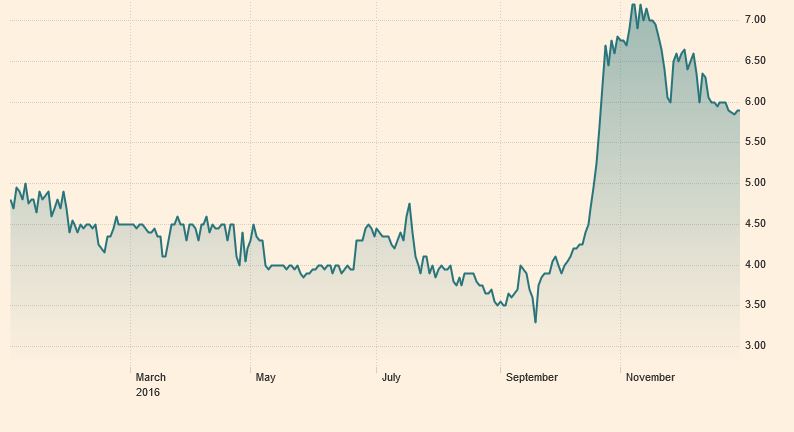
| 3. | Kenya Airways | 4.90 | 5.85 | +19.39 | 120,508,073 |
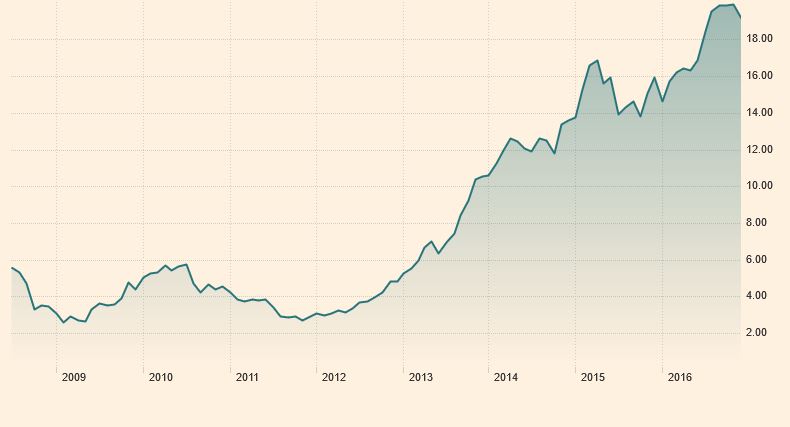
| 4. | Safaricom | 16.30 | 19.15 | +17.48 | 2,348,159,404 |
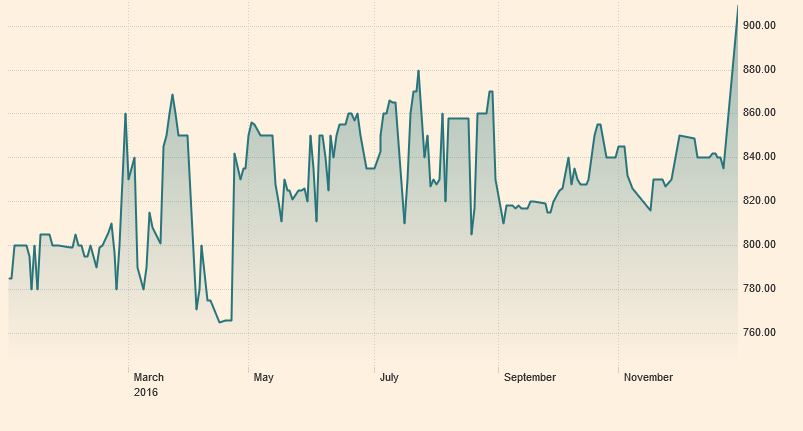
| 5. | British American Tobacco | 785.00 | 909.00 | +15.80 | 5,220,919 |
| 6. | KPLC 7% Preferred | 5.50 | 6.0 | +9.09 | – |
| 7. | Kenya Reinsurance Corp. | 21.00 | 22.50 | +7.14 | 32,958,905 |
| 8. | Longhorn Publishers | 4.50 | 4.80 | +6.67 | 57,394,530 |
| 9. | KPLC 4% Preferred | 5.30 | 5.50 | +3.77 | – |
| 10. | Unga Group | 33.75 | 34.50 | +2.22 | 1,761,202 |
| 11. | Jubilee Holdings | 484.00 | 490.00 | +1.24 | 1,892,209 |
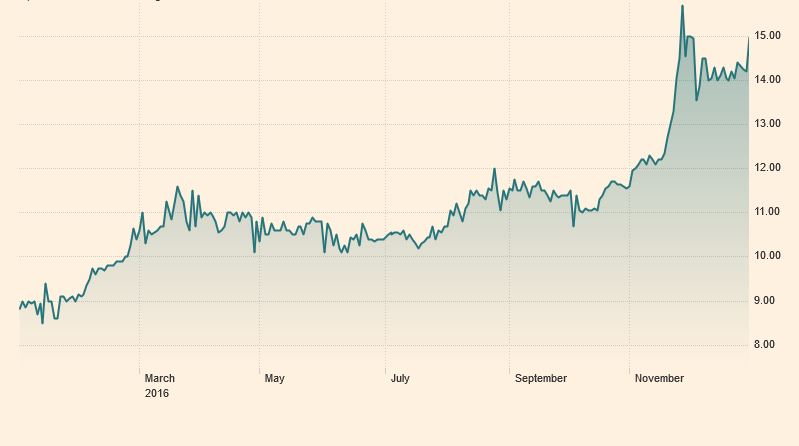
Kenol Kobil
Kenol Kobil is a Kenya-based company engaged in the importation of refined and other petroleum products for storage and distribution.
Kenol Kobil has been making significant progress in reducing its debt load since 2013 in a restructuring effort. The company managed to dispose-off loss making subsidiaries in Tanzania and a depot in Congo thus boosting their cash flows.
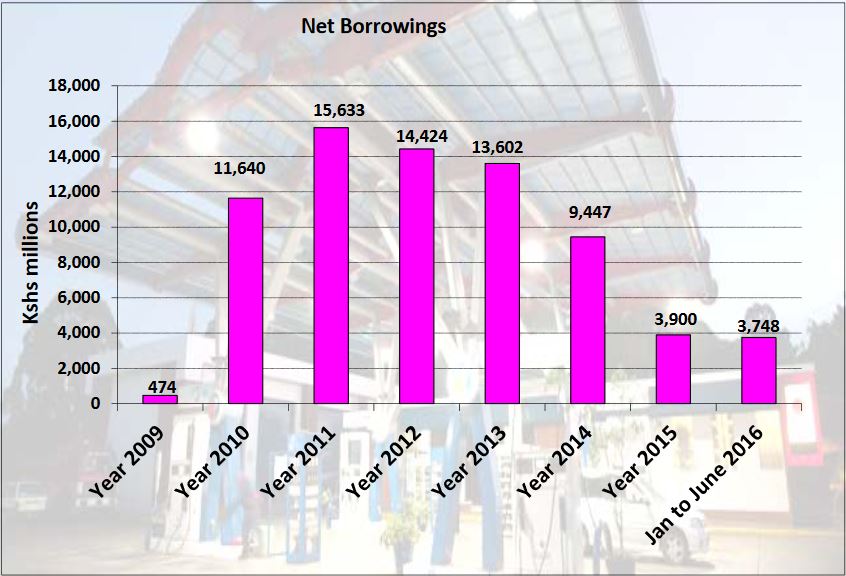
These improvements have had an effect on the share price making it return well over 50% in 2016. Kestrel Capital in an October 2016 research note forecasted the counter to gain to a target price of KSH 13.43 which currently has been surpassed and the counter is trading at KSH 14.90. The company is expected to have paid down all local currency debt by FY16 remaining with US Dollar denominated debt from 2017.
Kenya Airways
Kenya Airways was an interesting counter in 2016. The price broke off its resistance levels in October after an announcement of new changes at the board hiring a former successful Safaricom Chief Executive Mr. Michael Joseph as the Chairman. The airline is still struggling to turn-around to profitability but restructuring efforts are underway and some improvement has been made.
Safaricom
Safaricom which is one of the most profitable companies in Kenya has been constantly outperforming the market year-on-year and maintains a dominant market share of 65.2%.
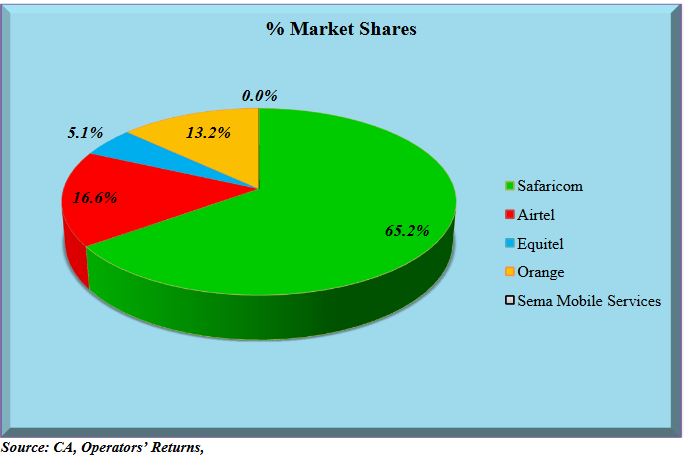
With solid fundamentals, Safaricom is a telco which doesn’t miss on any fund managers portfolio. The share price performance speaks of itself. Safaricom was the most heavily traded counter with over 2 billion shares exchanging investors’ hands in 2016
British American Tobacco
BAT stock rallied by 15.8% during the year with an absolute return of KES 124.00 per share. BAT has a dividend payout ratio of 95%.
Losers of the Year
In 2015, 48 companies were in the red zone, in 2016 the number increased to 54 representing roughly 81% of all equity listed securities, this is what you call a bear market!
| Company | 31 Dec. 2015 Price | 30 Dec. 2016 Price | % Loss | Shares Traded | |
| 1. | Uchumi Supermarkets | 10.95 | 3.95 | -63.93 | 24,029,279 |
| 2. | Kapchorua Tea | 200.00 | 80.00 | -60.00 | 193,135 |
| 3. | Deacons | 15.00 | 6.05 | -59.67 | 3,294,134 |
| 4. | National Bank of Kenya | 15.75 | 7.20 | -54.29 | 4,456,182 |
| 5. | Sanlam Kenya Plc | 60.00 | 27.50 | -54.17 | 35,826,946 |
| 6. | Home Afrika | 2.60 | 1.20 | -53.85 | 56,918,390 |
| 7. | Williamson Tea Kenya | 384.00 | 178.00 | -53.65 | 998,508 |
| 8. | Nation Media Group | 191.00 | 93.00 | -51.31 | 5,924,092 |
| 9. | Limuru Tea | 1,085.00 | 530.00 | -51.15 | 89,166 |
| 10. | Atlas African Industries | 2.10 | 1.05 | -50.00 | 21,350,701 |
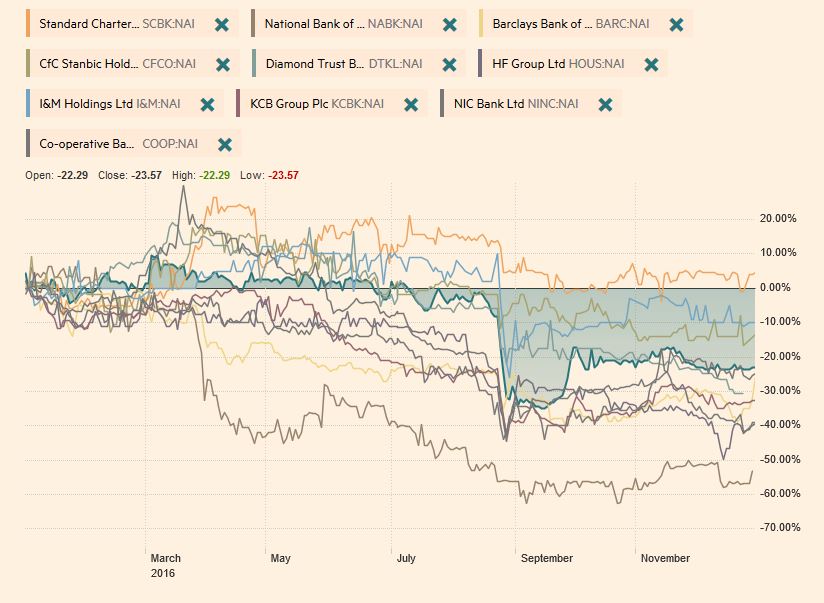
Banking Sector
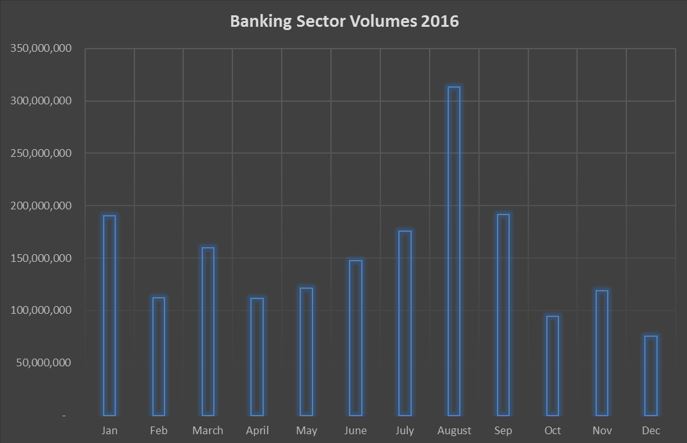
The banking sector begun facing a new reality in 2016. Hardly any counter on this sector ended the year on a positive. The sector currently has a PE ratio of 6.02 compared to 7.88 in the beginning of the year. A fundamental reset button was triggered on August when the interest rate capping bill was approved effectively capping lending rates at 4% above the Central Bank’s benchmark lending rate.
Interestingly this event triggered increased volume of trading activity in that month as shown in the chart below:
Fixed Income Market
The bond market had increased activity in 2016 with a 41.9% increase in turnover compared to 2015. Turnover in 2016 stood at KES 434.7 Billion compared to KES 306.2 Billion. Many investors re-balanced their portfolios and locked in on government paper which offered attractive interest rates due to the turmoil experienced in equities.
Economic Highlights
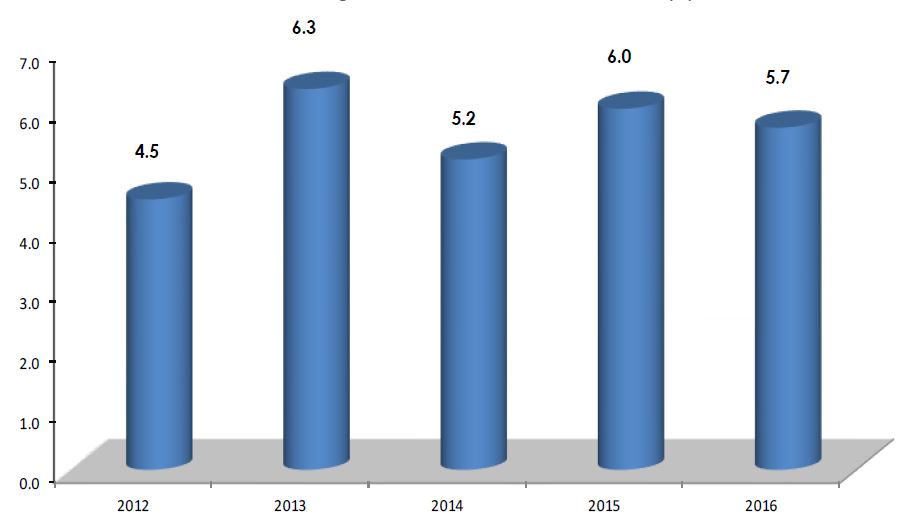
GDP Growth
Kenya’s economy grew by 5.7 percent year-on-year in the third quarter of 2016 compared to 6.0 percent growth in the third quarter of 2015.
According to the statistics office economic growth was ‘well spread’ although there was a slow-down in most of the sectors.
Economic activity in the agriculture, forestry and fishing sector slowed down by 3.9% compared to 5.5% growth in a similar period in 2015. Manufacturing and construction industry also slowed down in growth
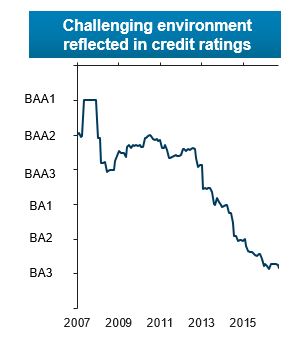
Sovereign Ratings
| Country | S&P | Moody’s | Fitch |
| Kenya | B+ Stable | B1 Stable | B+ Negative |
| Uganda | B Stable | B2 Stable | B+ Stable |
| Rwanda | B+ Stable | B2 Stable | B+ Stable |
| Ethiopia | B Stable | B1 Stable | B Stable |
| Nigeria | B Stable | B1 Stable | B+ Stable |
| South Africa | BBB- Negative | Baa2 Negative | BBB- Negative |
| Egypt | B- Stable | B3 Stable | B Stable |
| Mozambique | CC Negative | Caa3 Negative | CC |
Generally, credit ratings have been trending downwards since 2007.
Forex Markets
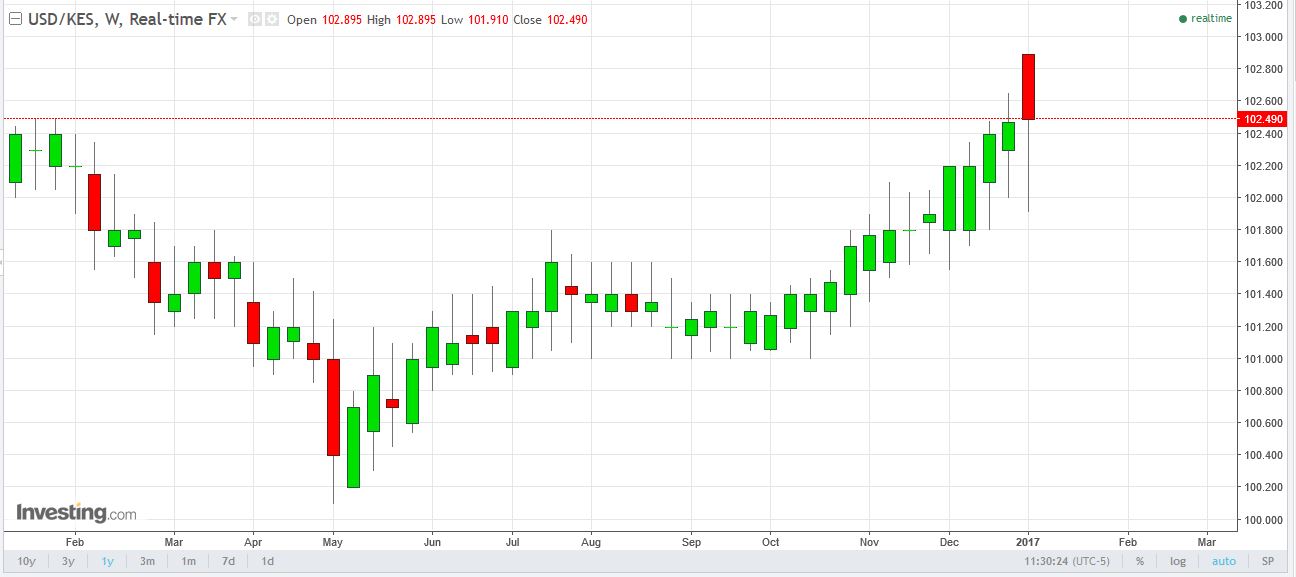
USD
In the year the Kenyan Shilling hovered between 100 and the 102 level against the greenback. It is currently trading at 102.490 against the dollar.
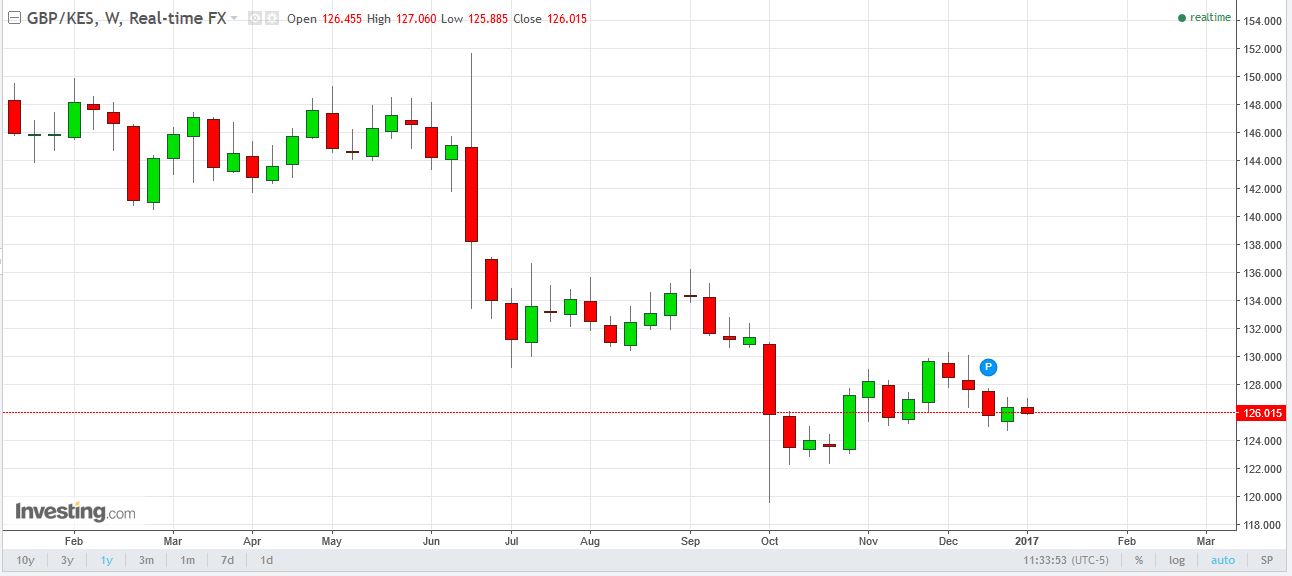
GBP
The Kenyan Shilling appreciated against the sterling by 14.46% to a current level of 126.015. The Brexit event in June was a huge factor.
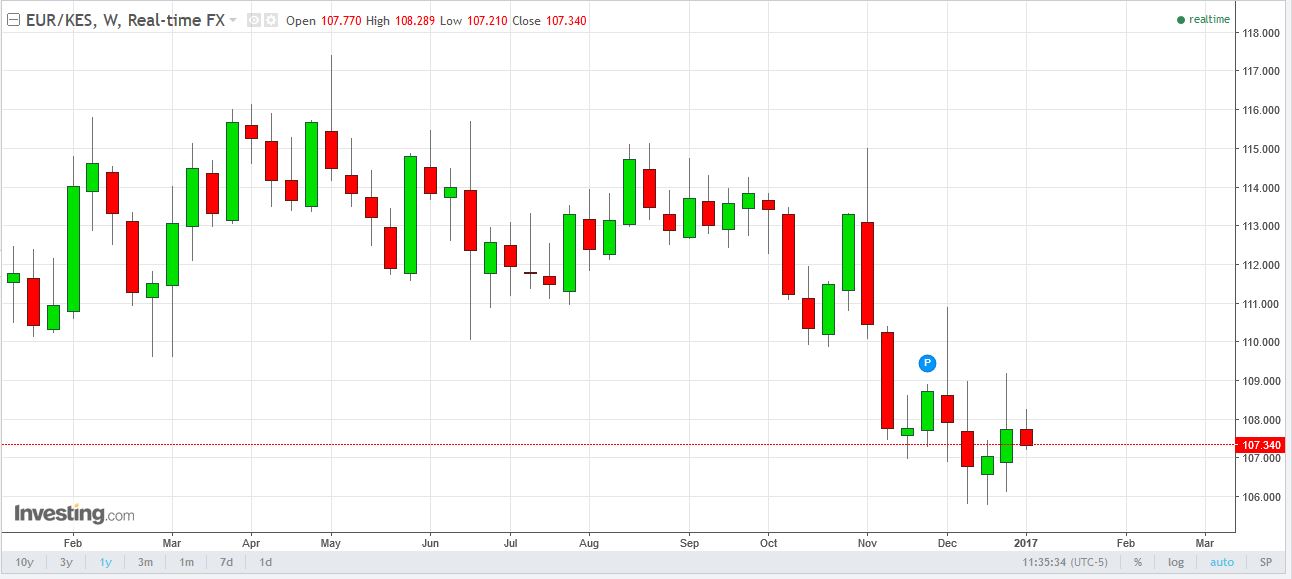
Euro
The Kenya Shilling appreciated by 3.6% against the Euro in 2016. It is currently trading at 107.340.
Related;
Kenya Q3 2016 GDP slows to 5.7pct
2016 was a tough one for those doing business in Africa
Fitch Affirms Kenya at B+ with Negative Outlook
Kenyan Stocks among Franklin Templeton Top Holdings in latest fillings
Kenya December Inflation Rate Falls to 6.35%
Sources: (Kenyan Wall Street, Bloomberg, NSE, FT, Kenol Kobil, Kestrel Capital, Communications Authority, KNBS, Barclays Research, Trading Economics)


