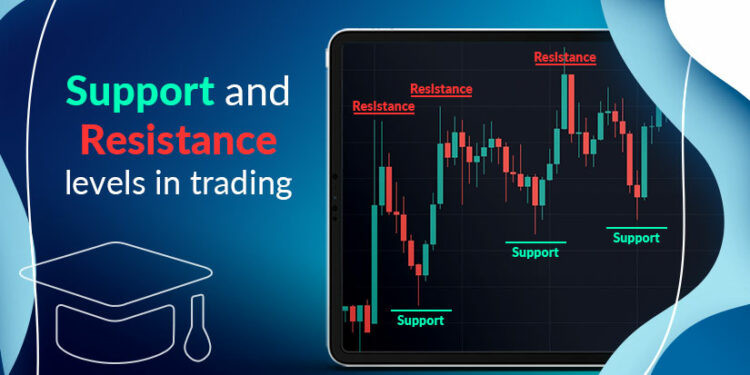
Stock trading involves identifying key Demand and Supply zones, also known as Support and Resistance zones. This approach is one of the most important foundational concepts in the technical analysis of the Stock Market. Understanding what these terms mean and their practical application is essential to correctly reading stock price charts. Stock Prices move because of supply and demand. When demand is greater than supply, prices rise. When supply is greater than demand, prices fall. Sometimes, prices will move sideways as both supply and demand are in equilibrium.
What Is Support? (Also known as Demand zone)
In a downtrend, prices fall because there is an excess of supply over demand. The lower prices go, the more attractive prices become to those waiting on the sidelines to buy the shares. At some level, demand that would have been slowly increasing will rise to the level where it matches supply. At this point, prices will stop falling. This is support. Support can be a price level on the chart or a price zone.
What Is Resistance? (Also known as supply zone)
Resistance is the opposite of support. Prices move up because there is more demand than supply. As prices move higher, there will come a point when the selling will overwhelm the desire to buy. At this point, prices will stop rising. This is Resistance. Resistance can be a price level on the chart or a price zone.

STOCK TRADING TIPS!!!
Support and resistance zones are good zones to buy or sell a share. This is because they act as blocks where price bounces. This means that price is likely to reverse and start falling at a previous resistance zone and vice versa. Traders normally draw lines on previous Support and Resistance zones and wait to see how prices react when they come back to ‘’test” these zones.

Sometimes previous Support zones turn into Resistance zones and vice versa. This means that if the price of a share breaks below a support zone it is likely to come back and bounce back on that zone to the downside.

NOTE!!! The more times that the price tests a support or resistance area, the more significant the level becomes. When prices keep bouncing off a support or resistance level, more buyers and sellers notice and will base trading decisions on these levels.
We also have another type of Support and Resistance commonly known as MOVING SUPPORT and RESISTANCE.
Some examples:
- Trendline
- Price using a Moving Average as support or resistance
WHAT ARE TREND LINES?
Trendlines are easily recognizable lines that traders draw on charts to connect a series of prices together. The resulting line is then used to give the trader a good idea of the direction of the stock price and possible reversal zones. Simply put, is a straight line that connects two or more price points and then extends into the future to act as a line of support or resistance. Let’s look at an example on a chart.

STOCK TRADING TIP: From the example above, a trader who had drawn the Support Trend in advance would have had a good idea of potential places to buy the shares and vice-versa.
WHAT ARE MOVING AVERAGES?
Most technical stock traders incorporate the power of various technical indicators, such as moving averages, to aid in predicting future price movements. In fact, people who find it difficult to draw trendlines often will substitute them for moving averages. As you can see from the chart below, a moving average is a constantly changing line that smooths out past price data, allowing for easier identification of support and resistance. Notice how the price of the stock in the chart below finds support at the moving average when the trend is up, and how it acts as resistance when the trend is down.

Stock traders can use moving averages in a variety of ways, such as to anticipate moves to the upside when price lines cross above a key moving average or to exit trades when the price drops below a moving average. Regardless of how the moving average is used, it often creates “automatic” support and resistance levels. Most traders will experiment with different time periods in their moving averages so that they can find the one that works best for their trading time frame.
NOTE: TO ADD MOVING AVERAGES TO YOUR CHART, SEARCH FOR THE INDICATORS SECTION ON YOUR TRADING PLATFORM AND SELECT MOVING AVERAGES. YOU CAN THEN CHANGE THE SETTINGS TO YOUR LIKING. SOME OF THE MOST COMMON MOVING AVERAGES ARE THE 200 SMA (Simple Moving Average), 100 SMA, 50 SMA, 20 SMA, and 9 SMA.
EXTRA TIP FOR YOU!!
Another common characteristic of support/resistance is that the price of a stock may have a difficult time moving beyond a round number, such as 10usd or 50usd per share. Many people think in terms of a round number, and this carries over into the stock market. Because people have an easier time visualizing round numbers, many stock traders tend to buy or sell shares when the price is at a round number making these prices good Support & Resistance zones.
HAPPY TRADING!!
An Intro To Trading Psychology | 5 Tips


