
Barclays Bank Kenya Profit before tax for the period ended Sept 30 2016 fell by 4.4% to Sh 8.7 Billion compared to Sh 9.1 billion posted in the same period in 2015.
Major Highlights
Total Interest income grew by 16.6% from Sh 18.5 billion to sh 21.1 billion of which interest accrued from loans and advances to customers grew slightly from Sh 13.6 billion to 15.5 billion while interest from government securities remained unchanged at Sh 4 billion. Over this period, the lender increased its investments in government securities by 3.6%.
Its total operating income increased by 12.5% to Sh24.4 Billion while non interest income grew by 16.3% to Sh 7.6 billion on the back of a 38.5% growth in foreign exchange income.
Related;
Equity Bank Net Profit Up 18% despite massive rise in Bad Loans
KCB Group Q3 Net Profit Grows 15% to KSh 15.9Bn
The Bank’s loan book stood at sh 158.8 billion, representing a growth of 9.3% since the beginning of the year and 3.6% growth on a quarterly basis. Loan loss provision was up from Sh 986.7 million to sh 3.1 billion while customer deposits increased by 9.6% from Sh 159.4 billion in Q3 2015 to Sh 180.8 as of Q3 2016.
The Bank’s total operating expenses rose by 8.3% to Sh 15.7 billion from 12.6 billion mainly as a result of increased staff costs and other operating expenses as interest expenses grew 27.2% to Sh 4.2 Billion.
After tax profit fell to Sh 6 Billion from Sh 6.4 billion while Earnings Per Share (EPS) fell by 5.1% from Sh1.18 to Sh1.12.
Related; 300 jobs at risk as StanChart moves its regional service centre from Nairobi to India
Other Disclosures
Gross NPLs and advances increased by 49.3% to Sh 10.4 billion compared to Sh 5.3 Billion as of Dec 2015. Net NPLs exposure came in at Sh 2.3 billion vs Sh 1.03 billion in Dec 2015. Insider loans was unchanged at Sh 13.3 billion.
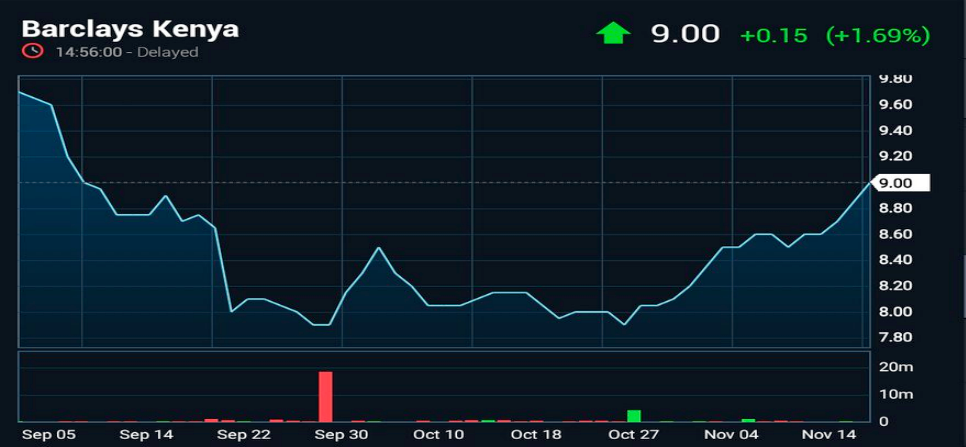
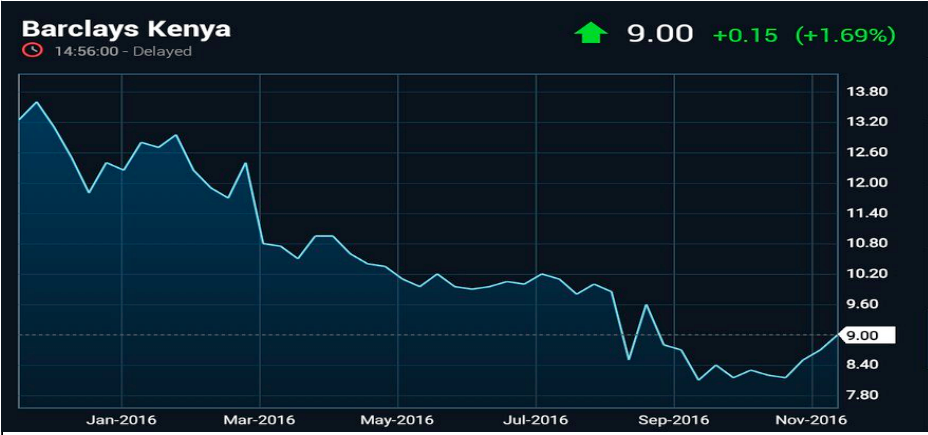
Share Price Movement
On Wednesday at the Nairobi Securities Exchange, Barclays Kenya stock closed at a two month high of Sh 9.00 but still down by 36% since the beginning of the year as shown in the two charts below.