

Published on July 14th, 2022 by Quinn Mohammed for SureDividend
Berkshire Hathaway (BRK.B) has an equity investment portfolio worth over $360 billion, as of the end of the 2022 first quarter.
Berkshire Hathaway’s portfolio is filled with quality stocks. You can follow Warren Buffett stocks to find picks for your portfolio. That’s because Buffett (and other institutional investors) are required to periodically show their holdings in a 13F Filing.
You can see all Warren Buffett stocks (along with relevant financial metrics like dividend yields and price-to-earnings ratios) by clicking on the link below:
Free Excel Download: Get a free Excel Spreadsheet of all Warren Buffett stocks, complete with metrics that matter – including P/E ratio and dividend yield. Click here to download Buffett’s holdings now.
Note: 13F filing performance is different than fund performance. See how we calculate 13F filing performance here.
As of March 31st, 2022, Buffett’s Berkshire Hathaway owned 315,400 shares of Procter & Gamble for a market value of $48.2 million. Procter & Gamble represents about 0.1% of Berkshire Hathaway’s investment portfolio. This marks it as one of the smallest positions in the portfolio.
This article will analyze the consumer staples company in greater detail.
Business Overview
Procter & Gamble is a consumer products giant that sells its products in more than 180 countries and generates over $76 billion in annual sales. Some of its core brands include Gillette, Tide, Charmin, Crest, Pampers, Febreze, Head & Shoulders, Bounty, Oral-B, and many more.
P&G is a mega-cap stock with a market capitalization of approximately $350 billion.
P&G has undergone massive portfolio restructuring over the past few years, as the company sold off a considerable percentage of its consumer brands. The company has reduced the number of brands in its portfolio from around 170 to about 65.
On April 20th, 2022, Procter & Gamble released Q3 fiscal year 2022 results. For the quarter, the company generated $19.4 billion in net sales, a 7% increase compared to Q3 2021.
This result was led by growth across the board. The company’s five reporting segments – Beauty, Grooming, Health Care, Fabric & Home Care, and Baby, Feminine & Family Care – posted increases of 2%, 3%, 13%, 7%, and 7%, respectively.
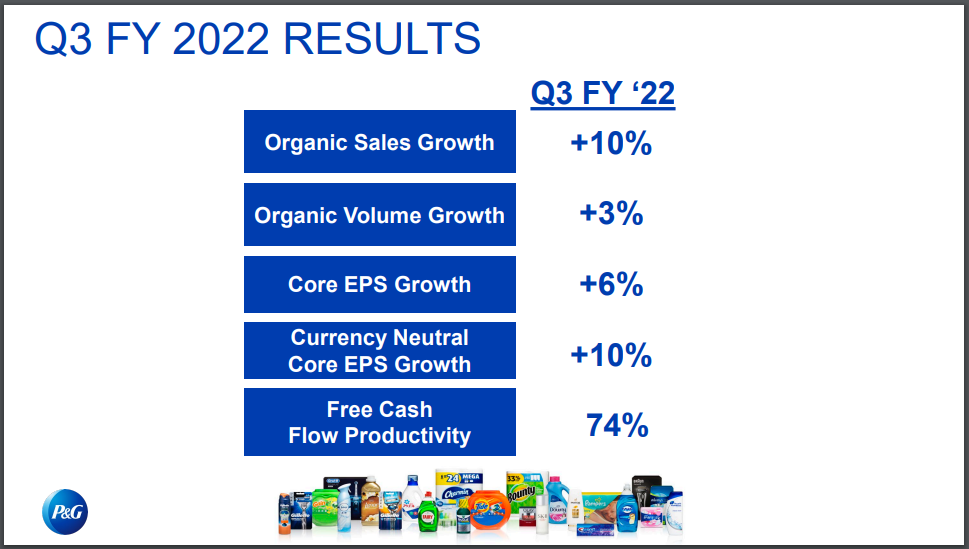
Source: Investor Presentation
Net earnings equaled $3.37 billion or $1.33 per share compared to $3.25 billion or $1.26 per share in Q3 2021. On an adjusted basis, core earnings-per-share increased 6% year-over-year, to $1.33.
Procter & Gamble also upgraded its fiscal 2022 sales estimate from previous guidance of 3% to 4%, to revised guidance of 4% to 5% growth. The company anticipates 3% to 6% core earnings-per-share growth from last year.
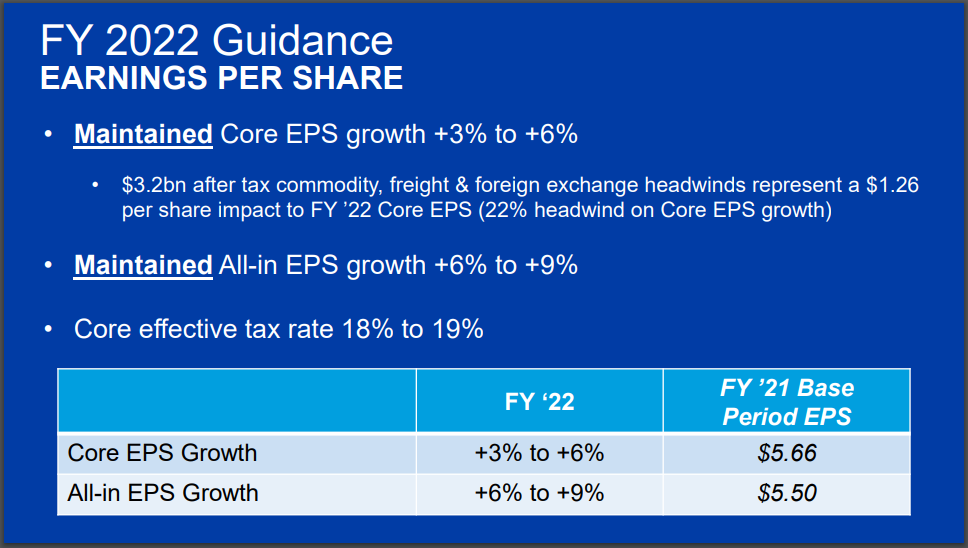
Source: Investor Presentation
We estimate that Procter & Gamble can generate $5.90 in earnings-per-share for the fiscal 2022 year.
Growth Prospects
Following P&G’s restructuring, the company is now a more agile and flexible organization with improved growth prospects. While P&G divested low-margin businesses with limited growth potential, it held on to its core consumer brands such as Tide, Charmin, Pampers, Gillette, and Crest.
With the main focus now on the company’s strongest and most profitable brands, P&G can benefit from lower costs and higher margins.
Margin expansion is an important component of P&G’s earnings growth strategy. P&G’s cost-cutting actions have raised its operating margins into the top of its peer group.
P&G received billions of dollars from its numerous asset sales, and a portion of that went to stock buybacks. These buybacks have also boosted P&G’s earnings-per-share over time.
Procter & Gamble may also continue growing through acquisitions. One such example is the acquisition of Merck’s global consumer health business in 2018. The acquisition included 10 core brands in vitamins, nutritional supplements, and other over-the-counter (OTC) products.
The global OTC market is expected to grow in the mid-single digits annually through 2025, which P&G should benefit from.
We project that the company can continue to grow earnings per share by about 4.0% annually through 2027.
Competitive Advantages & Recession Performance
P&G has multiple competitive advantages. The first and main advantage is its incredible brand portfolio. The company has several category-leading brands such as Crest, Tide, Gillette, Bounty, Febreze, Old Spice, Pampers, and many more. P&G owns several brands that generate $1 billion or more in annual sales. The company’s core brands sell high quality products that consumers are willing to pay a premium for.
To keep its competitive position, P&G invests heavily in advertising and research & development. Each year, the company invests billions more in R&D. These investments are a competitive advantage for P&G. R&D generates product innovation, while advertising helps market new products and gain market share.
P&G’s competitive advantages afford the company continued profitability, even during economic downturns. Earnings held up very well during the Great Recession:
- •2007 earnings-per-share of $3.04
- •2008 earnings-per-share of $3.64 (19.7% increase)
- •2009 earnings-per-share of $3.58 (-1.6% decline)
- •2010 earnings-per-share of $3.53 (-1.4% decline)
P&G showed strength in 2008, with almost 20% earnings growth. Then, earnings fell only slightly in the next two years. This should be considered an impressive performance in one of the worst economic downturns in the past several decades.
Additionally, P&G performed very well through the coronavirus pandemic. In fact, P&G has grown its earnings-per-share to new records throughout the entire ordeal to-date.
P&G is a recession-resistant business. People need paper towels, toothpaste, razors, and other P&G products, regardless of the economic climate.
Valuation & Expected Returns
Shares of Procter & Gamble have traded for an average price-to-earnings multiple of around 20. Shares are now trading above this average, which indicates that shares could be overvalued at the current 24.7 times earnings.
Our fair value estimate for Procter & Gamble stock is 20.0 times earnings. If this proves correct, the stock will incur a -4.1% annualized drag in its returns through 2027.
Shares of Procter & Gamble currently yield 2.5%, which is below its average yield of 3.1%. On a dividend yield basis, P&G shares seem to be trading above fair value.
Putting it all together, the combination of valuation changes, EPS growth, and dividends produces total expected returns of 2.4% per year over the next five years. This makes Procter & Gamble a sell.
The current dividend payout is adequately covered by earnings, with room to grow. Based on expected fiscal 2022 earnings, P&G has a payout ratio of 62%. We anticipate continued low-to-mid single-digit dividend increases in the years to come.
Final Thoughts
P&G is a constituent of both the Dividend Aristocrats and Dividend Kings lists. The company has increased its dividend for 66 years, proving that it can weather a slew of economic storms and still come out the other side stronger.
P&G has the brand strength, competitive advantages, and profitability to maintain its steady and annual dividend increases over the long term.
Due to the current overvaluation in the share price, it may be better to wait for a more favorable entry point.
This article was first published by Quinn Mohammed for Sure Dividend
Sure dividend helps individual investors build high-quality dividend growth portfolios for the long run. The goal is financial freedom through an investment portfolio that pays rising dividend income over time. To this end, Sure Dividend provides a great deal of free information.
Related:
Warren Buffett Stocks: Kraft Heinz
Warren Buffett Stocks: United Parcel Service


