

First Published on July 3rd, 2022 by Felix Martinez for SureDividend
Berkshire Hathaway (BRK.B) has an equity investment portfolio worth more than $360 billion as of the end of the 2022 first quarter.
Berkshire Hathaway’s portfolio is filled with quality stocks. You can ‘cheat’ from Warren Buffett stocks to find picks for your portfolio. That’s because Buffett (and other institutional investors) are required to periodically show their holdings in a 13F Filing.
You can see all Warren Buffett stocks (along with relevant financial metrics like dividend yields and price-to-earnings ratios) by clicking on the link below:
Free Excel Download: Get a free Excel Spreadsheet of all Warren Buffett stocks, complete with metrics that matter – including P/E ratio and dividend yield. Click here to download Buffett’s holdings now.
Note: 13F filing performance is different than fund performance. See how we calculate 13F filing performance here.
As of March 31, 2022, Buffett’s Berkshire Hathaway owned just over 327 thousand shares of Johnson & Johnson (JNJ) for a total market value exceeding $58.72 million. Johnson & Johnson currently constitutes over 0.02% of Berkshire Hathaway’s investment portfolio.
This article will thoroughly examine Johnson & Johnson’s prospects as an investment today.
Business Overview
Johnson & Johnson (JNJ), together with its subsidiaries, is engaged in researching, developing, manufacturing, and selling various products in the health care field worldwide. The company operates in three segments: Consumer, Pharmaceutical, and Medical Devices & Diagnostics.
The company is headquartered in New Brunswick, New Jersey, and the consumer division is in Skillman, New Jersey. The corporation includes some 250 subsidiary companies with operations in 60 countries and products sold in over 175 countries. Johnson & Johnson had sales of $93.8 billion worldwide during the calendar year 2021.
Johnson & Johnson’s brands include numerous household names of medications and first aid supplies. Its well-known consumer products include the Band-Aid Brand line of bandages, Tylenol medications, Johnson’s Baby products, Neutrogena skin, beauty products, Clean & Clear facial wash, and Acuvue contact lenses. Johnson & Johnson’s pharmaceutical arm is Janssen Pharmaceuticals.
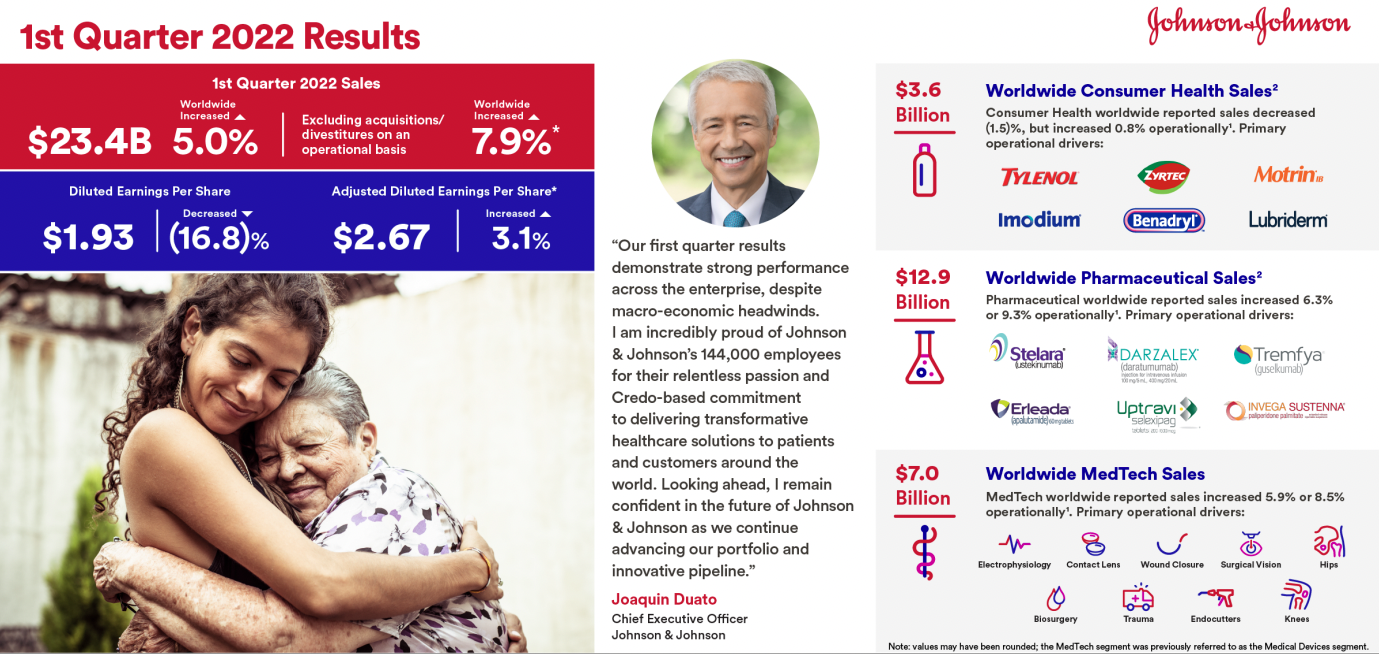
On April 19, 2022, the company reported first-quarter results for the 2022 Fiscal Year. Revenue increased 5% to $23.4 billion but missed estimates by $210 million. Adjusted earnings-per-share of $2.67 compared to $2.59 in the prior year was $0.10 better than expected.
Adjusted net earnings were 3% higher than the first quarter of last year. This quarter, net earnings were $7,129 million compared to $6,924 million in the first quarter of 2021.
The Pharmaceutical segment, which is JNJ’s most significant segment, saw sales increase from $12,101 million to $12,869 million, an increase of 6.3% year-over-year. Oncology was leading the way with another quarter of 10% growth. Darzalex, treating multiple myeloma, continues to see a higher market share in all regions due to higher uptake rates. Imbruvica, which treats lymphoma, declined yearly due to competition but remained the top treatment option in its area.
Immunology improved by 5.2%, driven once again by higher demand for Stelara, which treats immune-mediated inflammatory diseases, in the areas of Crohn’s Disease and Ulcerative Colitis. Infectious Diseases continue to perform well, showing 30% growth.
Growth Prospects
The company’s growth will come from intellectual property in the drug group, switching costs in the device segment, and strong brand power from the consumer group.
The company has been growing earnings over the past ten years with a 6.7% CAGR. We expect the company to continue this growth rate, but a little slower at a 6% annual rate.
Another growth driver of earnings will come from share buybacks. Over the past ten years, the company has been decreasing its outstanding shares by 0.6% CARG.
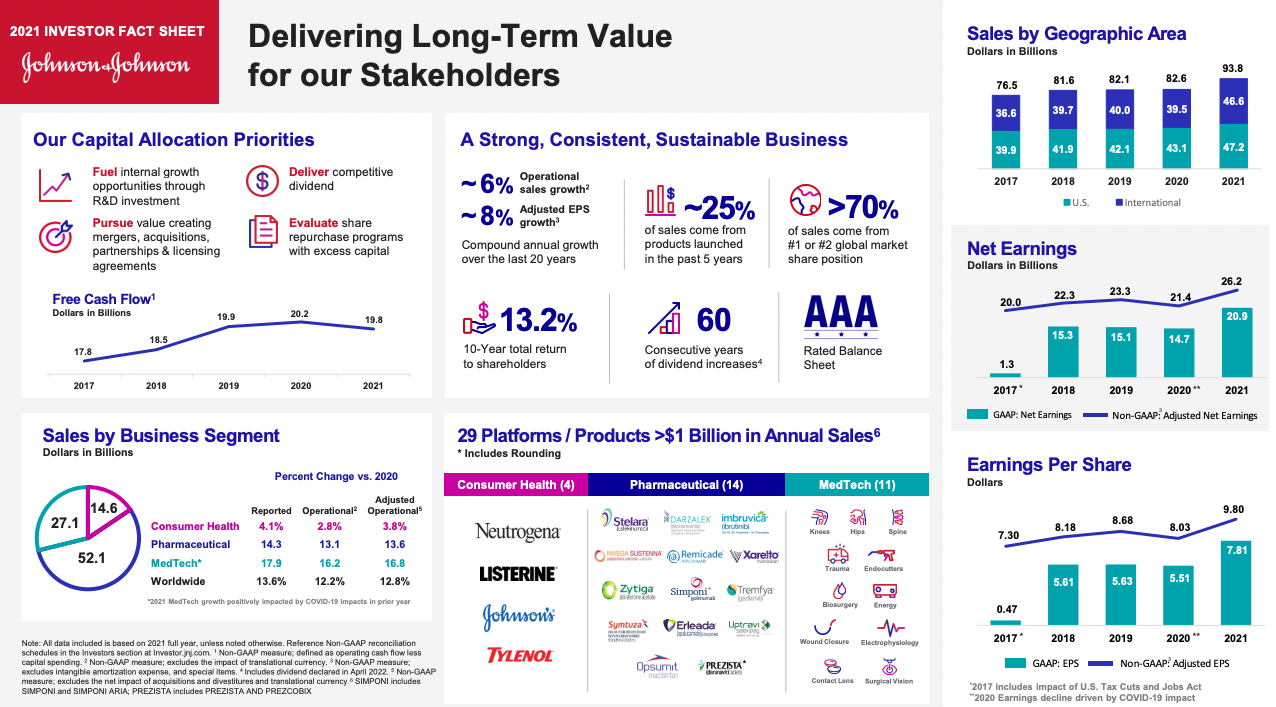
Another growth driver will be to increase sales in the international segment. AS you see below, the worldwide business segment makes up 52.1% of sales. This was increased by 13.6% compared to 2020.
Competitive Advantages & Recession Performance
Johnson & Johnson’s key competitive advantage is the size and scale of its business. The company is a worldwide leader in several healthcare categories. Johnson & Johnson’s diversification allows it to continue to grow even if one of the segments is underperforming. This can be seen in the last quarterly report, where gains in Medical Devices and Pharmaceuticals offset declines in consumers.
Also, the company is not dependent on one segment. For example, the pharmaceutical business, medical device group, and consumer products represent close to 50%, 30%, and 20% of total sales, respectively. Additionally, within each segment, no one product dominates sales.
During the Great Recession, earnings grew in 2008 by 10%, and they grew by 2% in 2009. This speaks volumes about how resilient the company is. However, during the COVID-19 pandemic, the company did see earnings decrease by 7% compared to 2019. However, it bounced back strong with a 22% increase in earnings for 2021, which was higher than 2019.
Valuation & Expected Returns
We expect the company to increase 2022 earnings by 5% compared to 2021. Thus, we expect that the company will make $10.25 per share.
The current price of $179.50 gives us a PE ratio of 17.9x earnings. This is high compared to its ten-year average of 16.8x earnings. This gives investors a slight headwind in expected total return.
The company dividend yield is 2.5%, which is higher than the S&P 500 but a little lower than the company’s five-year average of 2.6%.
Overall, we expect the company to produce a total return of about 8% annually over the next five years.
Final Thoughts
Johnson & Johnson reported a steady quarter; something shareholders have seen many times over the years. This continued growth has enabled the company to extend its dividend growth streak to six decades. Johnson & Johnson remains on track to divest its consumer business to focus on the faster-growing pharmaceutical and medical device segments.
Thus, we rate this stock as a hold right now and want to see it lower the 16.5x earnings.
This article was first published by Felix Martinez for Sure Dividend
Sure dividend helps individual investors build high-quality dividend growth portfolios for the long run. The goal is financial freedom through an investment portfolio that pays rising dividend income over time. To this end, Sure Dividend provides a great deal of free information.
Related:
Warren Buffett Stocks: Snowflake Inc.
Warren Buffett Stocks: T-Mobile US Inc.


