Data updated daily. Constituents updated annually for Suredividend
In order to create a dividend income stream that varies little from month-to-month, retirees (and other income-oriented investors) must be able to determine which stocks pay dividends in each month of the calendar year.
That’s where Sure Dividend comes in. We maintain a free database of stocks that pay dividends in June (along with important metrics such as price-to-earnings ratios and dividend yields), which you can download by clicking below:

The list of stocks that pay dividends in June available for download above contains the following information for every stock in the database:
- •Last dividend payment date in the month of June
- •Dividend yield
- •Payout ratio
- •Price-to-earnings ratio
- •Price-to-book ratio
- •Market capitalization
- •Return on equity
- •3-year beta
Keep reading this article to learn more about how to maximize the usefulness of our database of stocks that pay dividends in June.
Note: Constituents for the spreadsheet and table above are from the Wilshire 5000 index, with data provided by Ycharts and updated annually. Securities outside the Wilshire 5000 index are not included in the spreadsheet and table.
How To Use Our List of Stocks That Pay Dividends in June to Find Investment Ideas
Having an Excel document that contains the name, ticker, and financial information of every stock that pays dividends in June can be very useful.
This document becomes even more powerful when combined with a working knowledge of Microsoft Excel.
With that in mind, this tutorial will demonstrate how you can implement two additional investing screens to our list of stocks that pay dividends in June.
The first screen that we’ll implement is for stocks that distribute the majority of their earnings to shareholders and also trade at reasonable price multiples of these earnings. More specifically, we’ll filter for stocks with payout ratios between 50% and 100% and price-to-earnings ratios below 15.
Screen 1: Stocks With Payout Ratios Between 50% and 100% and Price-to-Earnings Ratios Below 15
Step 1: Download your list of stocks that pay dividends in June by clicking here.
Step 2: Click on the filter icon at the top of the payout ratio column, as shown below.

Step 3: Change the filter setting to “Greater Than” and input 0.5 into the field beside it, as shown below. Since payout ratio is measured in percentage points, this will filter for stocks that pay dividends in June with payout ratios above 50%.
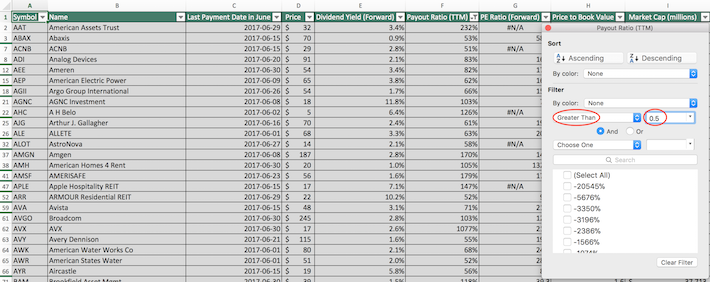
Step 4: Change the secondary filter setting to “Less Than” and input 1 into the field beside it, as shown below. Since payout ratio is measured in percentage points, this will filter for stocks that pay dividends in June that have payout ratios below 100%.
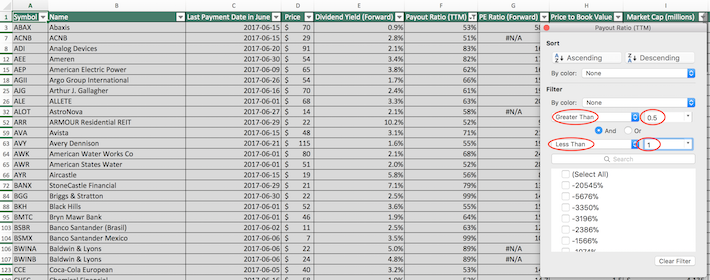
Step 5: Close out of the filter window (by clicking the exit button, not by clicking the “Clear Filter” button in the bottom right corner). Next, click the filter icon at the top of the price-to-earnings ratio column, as shown below.

Step 6: Change the filter setting to “Less Than” and input 15 into the field beside it, as shown below. This will filter for stocks that pay dividends in June with price-to-earnings ratios below 15.

The remaining stocks in the spreadsheet are stocks that pay dividends in June with payout ratios between 50% and 100% that also have price-to-earnings ratios below 15.
The next screen we’ll implement is for stocks with price-to-book ratios below 2 and large-cap stocks with market capitalizations above $10 billion.
Screen 2: Price-to-Book Ratios Below 2, Market Capitalizations Above $10 Billion
Step 1: Download your list of stocks that pay dividends in June by clicking here.
Step 2: Click the filter icon at the top of the price-to-book ratio column, as shown below.

Step 3: Change the filter setting to “Less Than” and input 2 into the field beside it. This will filter for stocks that pay dividends in June with price-to-book ratios below 2.
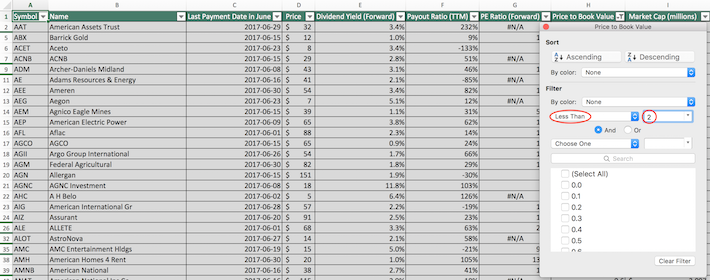
Step 4: Close out of the filter window (by clicking the exit button, not by clicking the “Clear Filter” button in the bottom right corner). Then, click the filter button at the top of the market capitalization column, as shown below.

Step 5: Change the filter setting to “Greater Than” and input 10000 into the field beside it. Note that since market capitalization is measured in millions of dollars, filtering for stocks with market capitalizations above “10000 million” is equivalent to screening for securities with capitalizations above $10 billion.
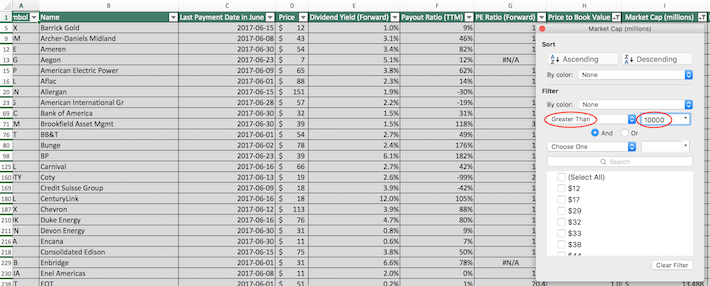
The remaining stocks in this spreadsheet database are stocks that pay dividends in June that have price-to-book ratios below 2 and market capitalizations above $10 billion.
You now have a working understanding of how to use Microsoft Excel to implement additional financial screens to our list of stocks that pay dividends in June.
The remainder of this article will introduce other investing resources that can help you make better decisions along your investing journey.
Final Thoughts
Having an Excel document that contains the name and financial data of stocks that pay dividends in June is very powerful, but is limited in its usefulness unless it can be paired with similar financial information for the other 11 calendar months.
Related:
The 6 Best Beer Stocks To Invest In Now For Dividends And Growth
2023 Dividend Contenders List | Dividend Yield, Payout Ratio, & More


