First Published on January 31st, 2023 by Josh Arnold for SureDividend. Spreadsheet data updated daily
In the world of investing, volatility matters.
Investors are reminded of this every time there is a downturn in the broader market and individual stocks that are more volatile than others experience enormous swings in price in both directions.
That volatility can increase the risk in an individual’s stock portfolio relative to the broader market.
The volatility of a security or portfolio against a benchmark – is called Beta. In short, Beta is measured via a formula that calculates the price risk of a security or portfolio against a benchmark, which is typically the broader market as measured by the S&P 500 Index.
It is helpful in understanding the overall price risk level for investors during market downturns in particular.
Here’s how to read stock betas:
- •A beta of 1.0 means the stock moves equally with the S&P 500
- •A beta of 2.0 means the stock moves twice as much as the S&P 500
- •A beta of 0.0 means the stocks moves don’t correlate with the S&P 500
- •A beta of -1.0 means the stock moves precisely opposite the S&P 500
Interestingly, low beta stocks have historically outperformed the market… But more on that later.
You can download a spreadsheet of the 100 lowest beta stocks (along with financial metrics like price-to-earnings ratios and dividend yields) by clicking on the link below:

This article will discuss how to calculate beta, the difference between high-beta and low-beta stocks, as well as individual analysis of the 3 stocks in the S&P 500 Index with negative beta values.
The table of contents provides for easy navigation of the article:
Table of Contents
- •High Beta Stocks Versus Low Beta Stocks
- •How To Calculate Beta
- •Beta & The Capital Asset Pricing Model (CAPM)
- •Analysis On The S&P 500 Stock With Negative Beta
- •Final Thoughts
High Beta Stocks Versus Low Beta
Beta is helpful in understanding the overall price risk level for investors during market downturns in particular. The lower the Beta value, the less volatility the stock or portfolio should exhibit against the benchmark.
This is beneficial for investors for obvious reasons, particularly those that are close to or already in retirement, as drawdowns should be relatively limited against the benchmark.
Low or high Beta simply measures the size of the moves a security makes; it does not mean necessarily that the price of the security stays nearly constant.
Securities can be low Beta and still be caught in long-term downtrends, so this is simply one more tool investors can use when building a portfolio.
Intuitively, it would make sense that high Beta stocks would outperform during bull markets. After all, these stocks should be achieving more than the benchmark’s returns given their high Beta values.
While this can be true over short periods of time – particularly the strongest parts of the bull market – the high Beta names are generally the first to be sold heavily by investors.
This excellent paper from the CFA Institute theorizes that this is true because investors are able to use leverage to bid up momentum names with high Beta values and thus, on average, these stocks have lower prospective returns at any given time.
In addition, leveraged positions are among the first to be sold by investors during weak periods because of margin requirements or other financing concerns that come up during bear markets.
While high Beta names may outperform while the market is strong, as signs of weakness begin to show, high Beta names are the first to be sold and generally, much more strongly than the benchmark.
Evidence suggests that during good years for the market, high Beta names capture 138% of the market’s total returns.
Therefore, if the market returned 10% in a year, high Beta names would, on average, produce 13.8% returns. However, during down years, high Beta names capture 243% of the market’s returns.
In a similar example, if the market lost 10% during a year, the group of high Beta names would have returned -24.3%.
Given this relatively small outperformance during good times and vast underperformance during weak periods, it is easy to see why we prefer low Beta stocks.
While low Beta stocks aren’t completely immune from downturns in the market, it is much easier to make the case over the long run for low Beta stocks versus high Beta given how each group performs during bull and bear markets.
How To Calculate Beta
The formula to calculate a security’s Beta is fairly straightforward. The result, expressed as a number, shows the security’s tendency to move with the benchmark.
Beta of 1.00 means that the security in question should move virtually in lockstep with the benchmark (as discussed briefly in the introduction of this article).
Beta of 2.00 means moves should be twice as large in magnitude.
Finally, a negative Beta means that returns in the security and benchmark are negatively correlated; these securities tend to move in the opposite direction from the benchmark.
This sort of security would be helpful to mitigate broad market weakness in one’s portfolio as negatively correlated returns would suggest the security in question would rise while the market falls.
For those investors seeking high Beta, stocks with values in excess of 1.3 would be the ones to seek out. These securities would offer investors at least 1.3X the market’s returns for any given period.
Here’s a look at the formula to compute Beta:

The numerator is the covariance of the asset in question while the denominator is the variance of the market. These complicated-sounding variables aren’t actually that difficult to compute.
Here’s an example of the data you’ll need to calculate Beta:
- •Risk-free rate (typically Treasuries at least two years out)
- •Your asset’s rate of return over some period (typically one year to five years)
- •Your benchmark’s rate of return over the same period as the asset
To show how to use these variables to do the calculation of Beta, we’ll assume a risk-free rate of 2%, our stock’s rate of return of 14% and the benchmark’s rate of return of 8%.
You start by subtracting the risk-free rate of return from both the security in question and the benchmark. In this case, our asset’s rate of return net of the risk-free rate would be 12% (14% – 2%). The same calculation for the benchmark would yield 6% (8% – 2%).
These two numbers – 12% and 6%, respectively – are the numerator and denominator for the Beta formula. Twelve divided by six yields a value of 2.00, and that is the Beta for this hypothetical security.
On average, we’d expect an asset with this Beta value to be 200% as volatile as the benchmark.
Thinking about it another way, this asset should be about twice as volatile than the benchmark while still having its expected returns correlated in the same direction.
That is, returns would be correlated with the market’s overall direction, but would return double what the market did during the period.
This would be an example of a very high Beta stock and would offer a significantly higher risk profile than an average or low Beta stock.
Beta & The Capital Asset Pricing Model
The Capital Asset Pricing Model, or CAPM, is a common investing formula that utilizes the Beta calculation to account for the time value of money as well as the risk-adjusted returns expected for a particular asset.
Beta is an essential component of the CAPM because without it, riskier securities would appear more favorable to prospective investors as their risk wouldn’t be accounted for in the calculation.
The CAPM formula is as follows:

The variables are defined as:
- •ERi = Expected return of investment
- •Rf = Risk-free rate
- •βi = Beta of the investment
- •ERm = Expected return of market
The risk-free rate is the same as in the Beta formula, while the Beta that you’ve already calculated is simply placed into the CAPM formula.
The expected return of the market (or benchmark) is placed into the parentheses with the market risk premium, which is also from the Beta formula. This is the expected benchmark’s return minus the risk-free rate.
To continue our example, here is how the CAPM actually works:
ER = 2% + 2.00(8% – 2%)
In this case, our security has an expected return of 14% against an expected benchmark return of 8%.
In theory, this security should vastly outperform the market to the upside but keep in mind that during downturns, the security would suffer significantly larger losses than the benchmark.
If we changed the expected return of the market to -8% instead of +8%, the same equation yields expected returns for our hypothetical security of -18%.
This security would theoretically achieve stronger returns to the upside but certainly much larger losses on the downside, highlighting the risk of high Beta names during anything but strong bull markets.
While the CAPM certainly isn’t perfect, it is relatively easy to calculate and gives investors a means of comparison between two investment alternatives.
Analysis On The S&P 500 Stocks With Negative Beta
Now, we’ll take a look at the S&P 500 stocks that had negative beta values. As of the time of publication, there were only three stocks in the S&P 500 Index with a negative beta value.
Negative Beta Stock: WD-40 Company (WDFC)
Our first stock is WD-40 Company, a chemicals manufacturer that focuses on maintenance products, homecare, and cleaning products globally. WD-40 sells its namesake product in various forms, but also has diversified into other product lines away from its core WD-40 line. The company was founded in 1953, generates about $545 million in annual revenue, and trades with a market cap of $2.3 billion.
WD-40 has a 14-year streak of consecutive dividend increases, and it has managed double-digit average annual increases in the past decade. That means it’s been one of the better small-cap dividend growth stocks over that period. Shares yield 1.9% today, which is meaningfully better than the S&P 500’s average yield of 1.6%.
WD-40 finds itself with a beta value of -0.19 against the S&P 500, which is the lowest value in the index. That means the stock is not only attractive on a dividend growth basis, but it trades inversely to the index itself, providing some measure of diversification for investors’ portfolios.
We see 6% growth looking forward over the next five years, driven by higher revenue and stable or better margins.
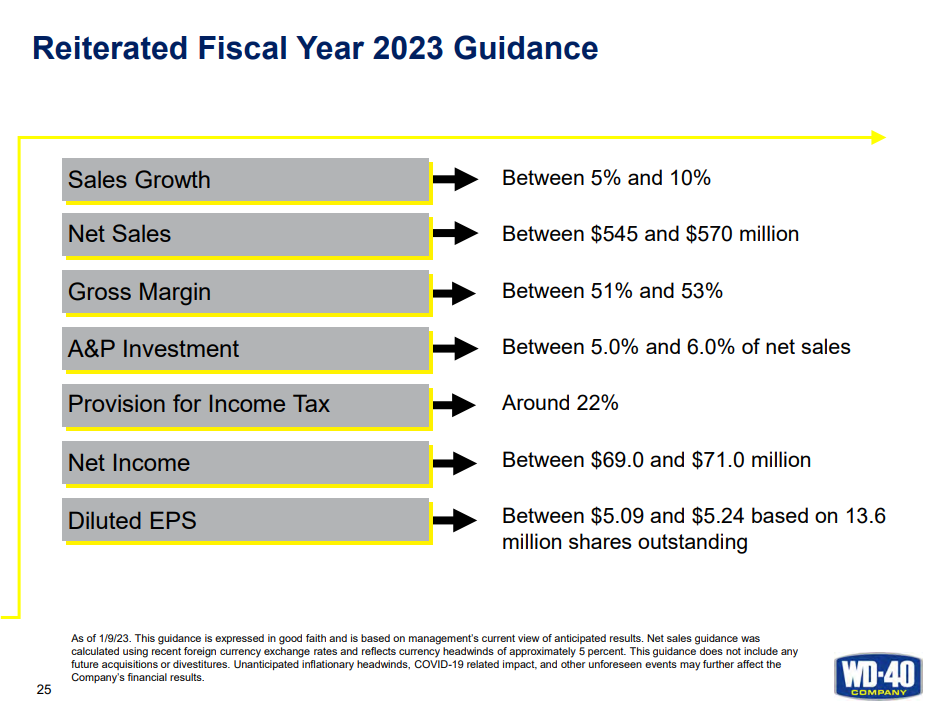
The company guided for $5.09 to $5.24 in earnings-per-share for this year, which would be a modest improvement on last year’s $4.90. We do see the stock as overvalued today, trading well above its fair value of 25 times earnings. That could drive a headwind to total returns in the coming years, but if the US equity markets are in for a period of selling on recession fears, WD-40’s negative beta may help it buck the trend.
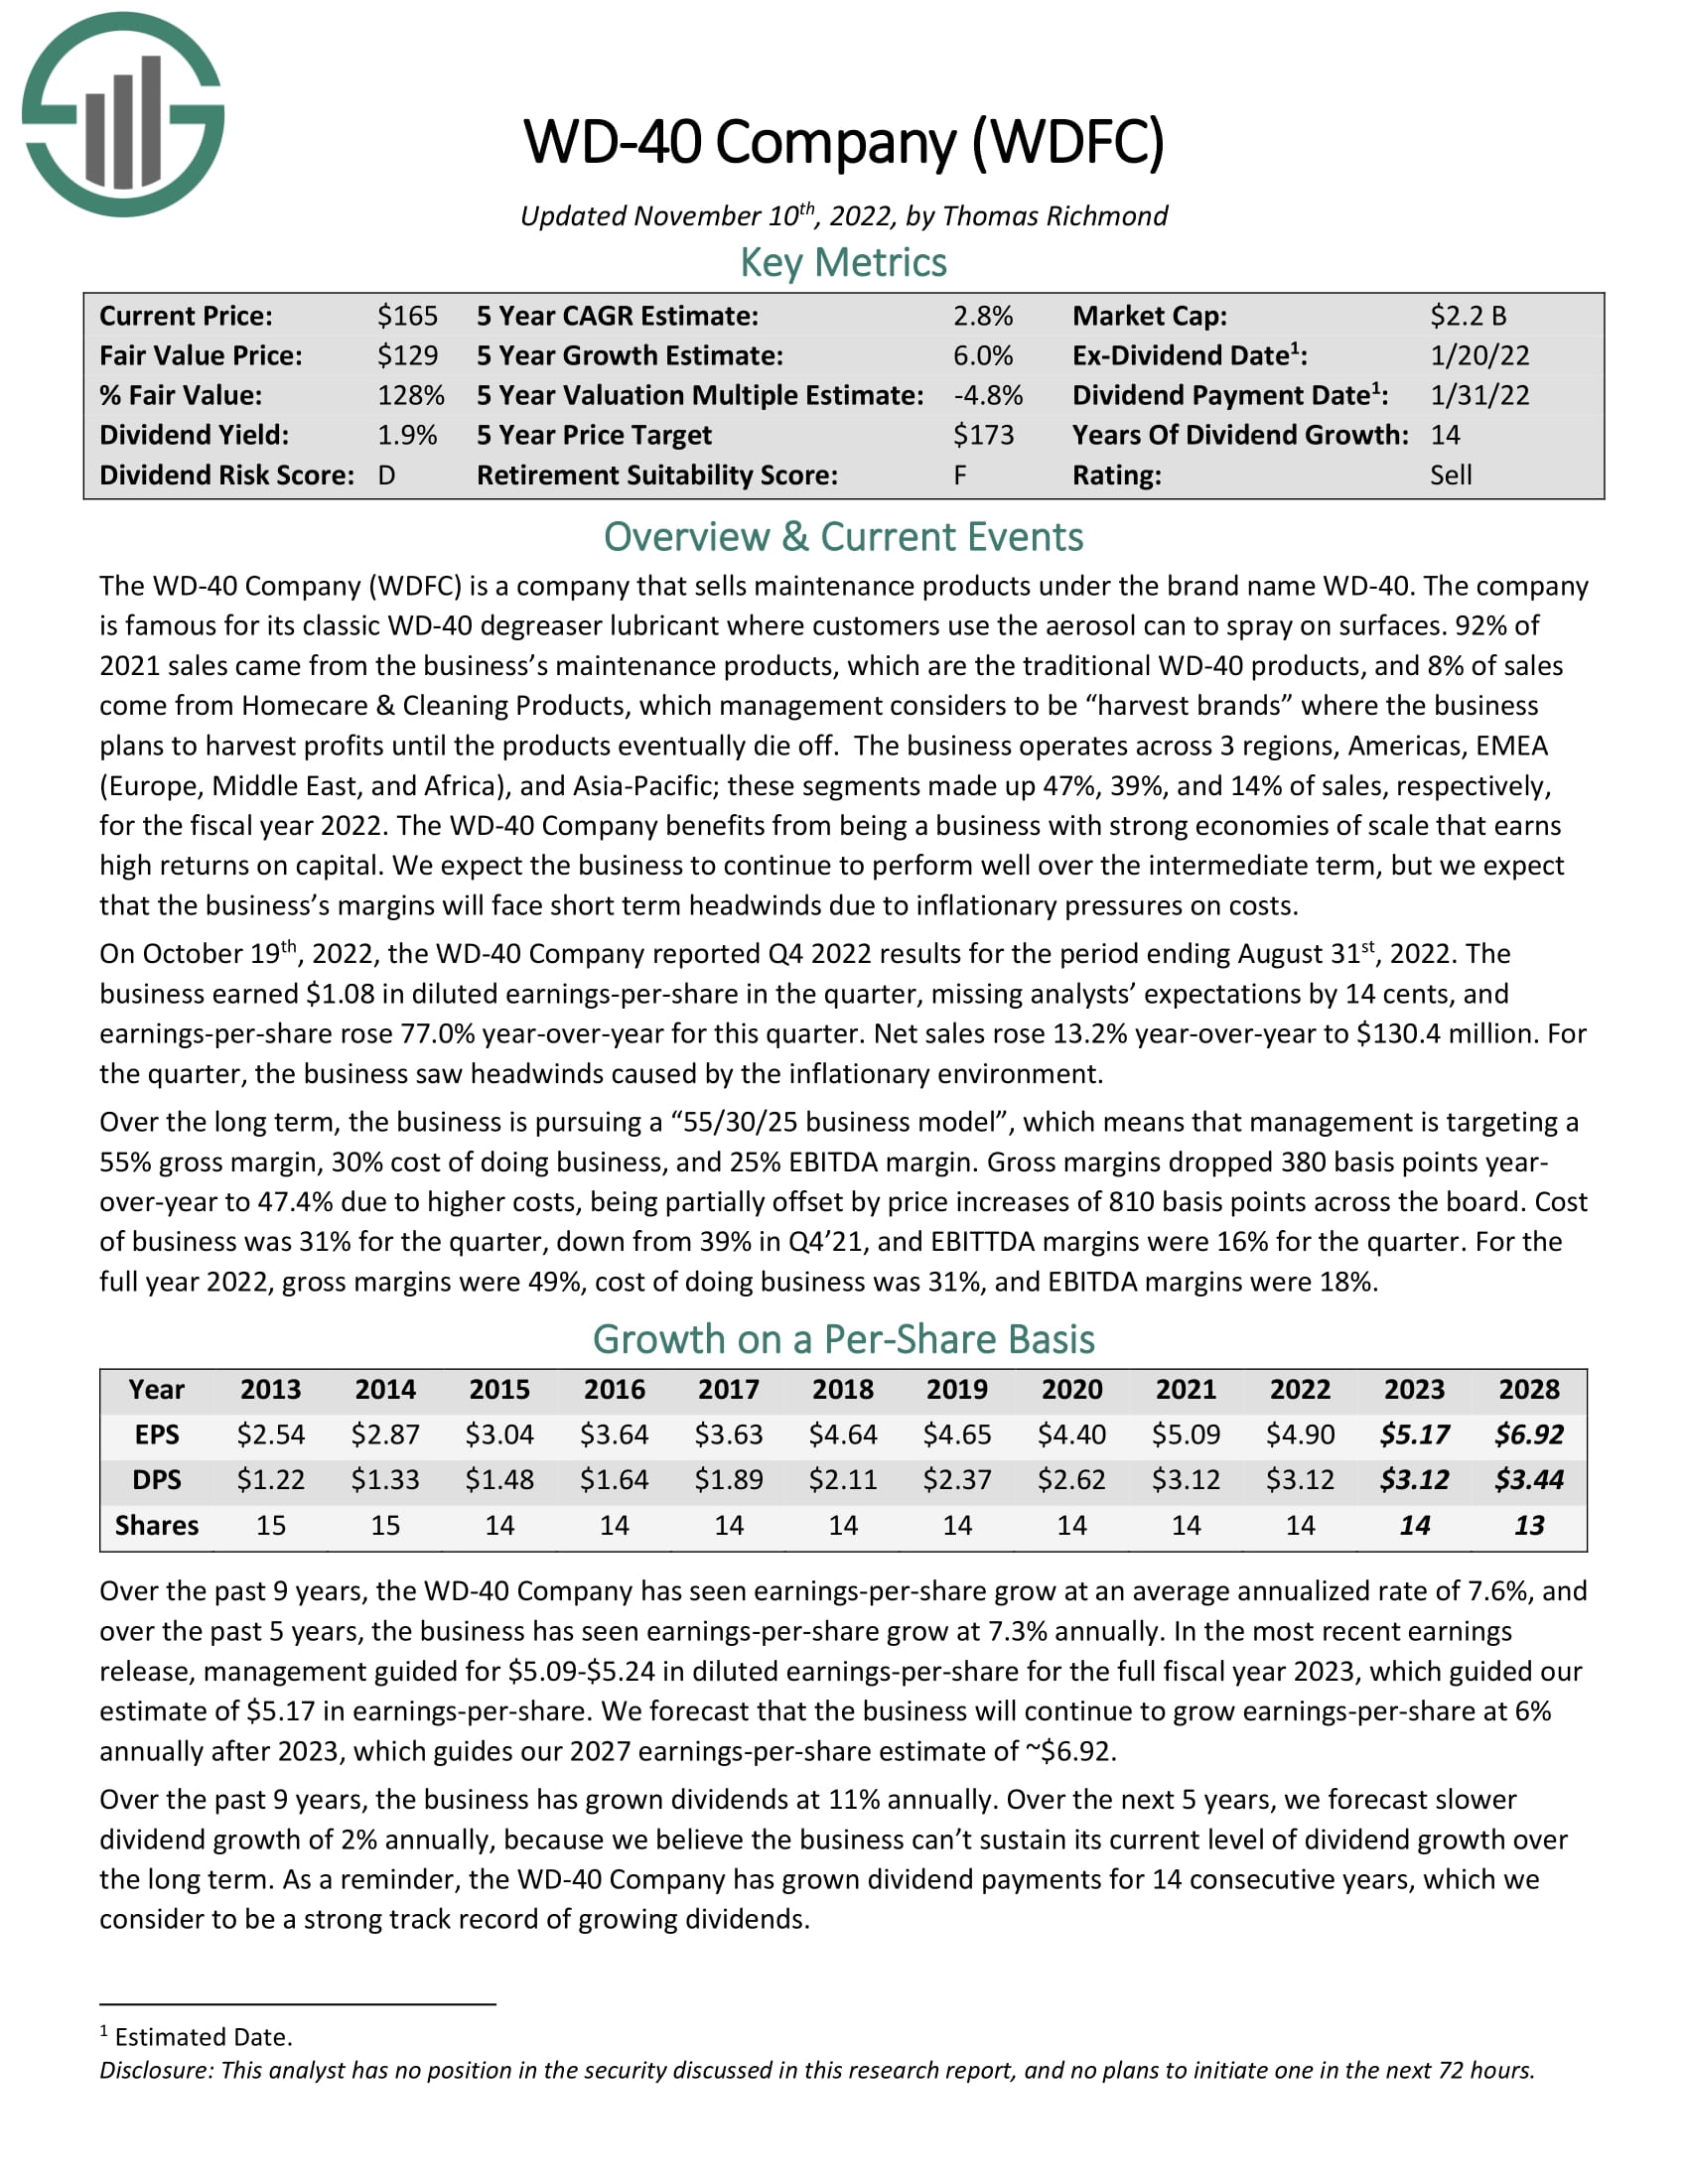
Click here to download our most recent Sure Analysis report on WDFC (preview of page 1 of 3 shown below):
Negative Beta Stock: Cal-Maine Foods, Inc. (CALM)
Our second stock is Cal-Maine Foods, a specialty food company that produces, grades, packages, markets, and distributes shell eggs. The company offers a variety of eggs, including nutritionally enhanced, cage free, organic, and brown eggs under various brands. These include Egg-Land’s Best, Land O’ Lakes, Farmhouse Eggs, and 4-Grain, in addition to private labels. Cal-Maine distributes its eggs through grocery chains throughout the US.
The company was founded in 1957, should produce about $3 billion in revenue this year, and trades with a market cap of $2.8 billion.
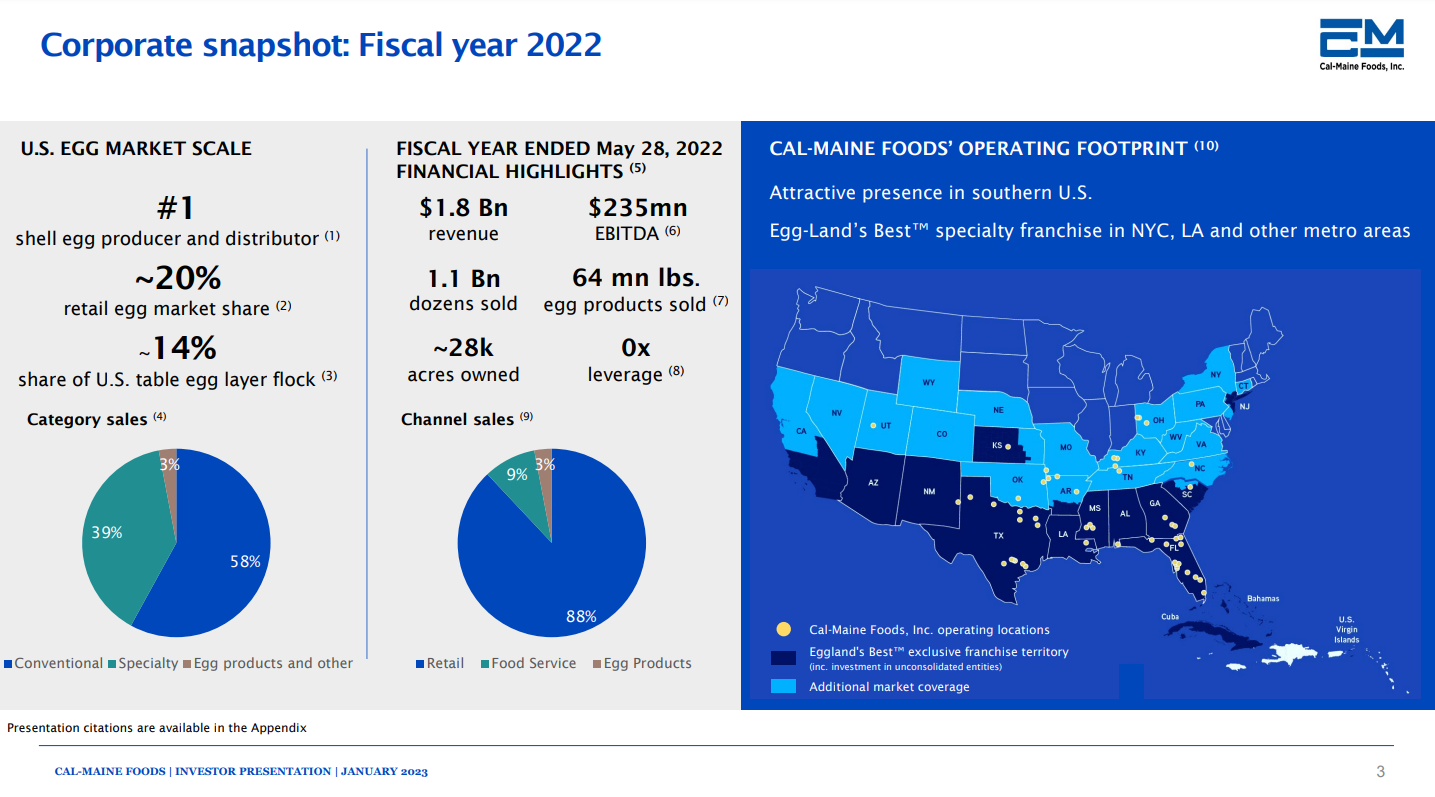
The company has been at the epicenter of the nearly unprecedented egg price inflation that has occurred in recent months, causing a spike in not only revenue, but earnings for fiscal 2023. As we can see, Cal-Maine is the top producer of shell eggs in the US, and has one-fifth of the retail market. That means it has been an enormous beneficiary of egg price inflation, and that is expected to drive record revenue and earnings for fiscal 2023, which ends in May.
However, this is unsustainable and we expect those conditions to reverse in the years to come, with normalized earnings to result from this normalization.
Cal-Maine’s beta value is -0.09, so it essentially trades with no correlation to the S&P 500 index. While the beta value is negative, it is only slightly negative, so we expect Cal-Maine to simply not correlate to the index over time.
Cal-Maine pays variable dividends, and it often pays no dividend at all. Given that, it has no dividend increase streak to speak of, but did make three payments in 2022, totaling $1.73 per share. It also made a a $1.35 per share dividend payment in January of 2023, but as earnings should decline markedly in the coming quarters, we believe that either the dividend will decline sharply, or cease altogether.
Negative Beta Stock: A-Mark Precious Metals, Inc. (AMRK)
Our final stock is A-Mark Precious Metals, a company that trades precious metals through three segments. These include: Wholesale Sales & Ancillary Services, Direct-to-Consumer, and Secured Lending. Through these segments A-Mark sells gold, sliver, platinum, and palladium in bars, plates, powders, wafers, grains, ingots, and coins. The company operates globally, was founded in 1965, produces about $8 billion in annual revenue, and trades with a market cap of about $900 million.
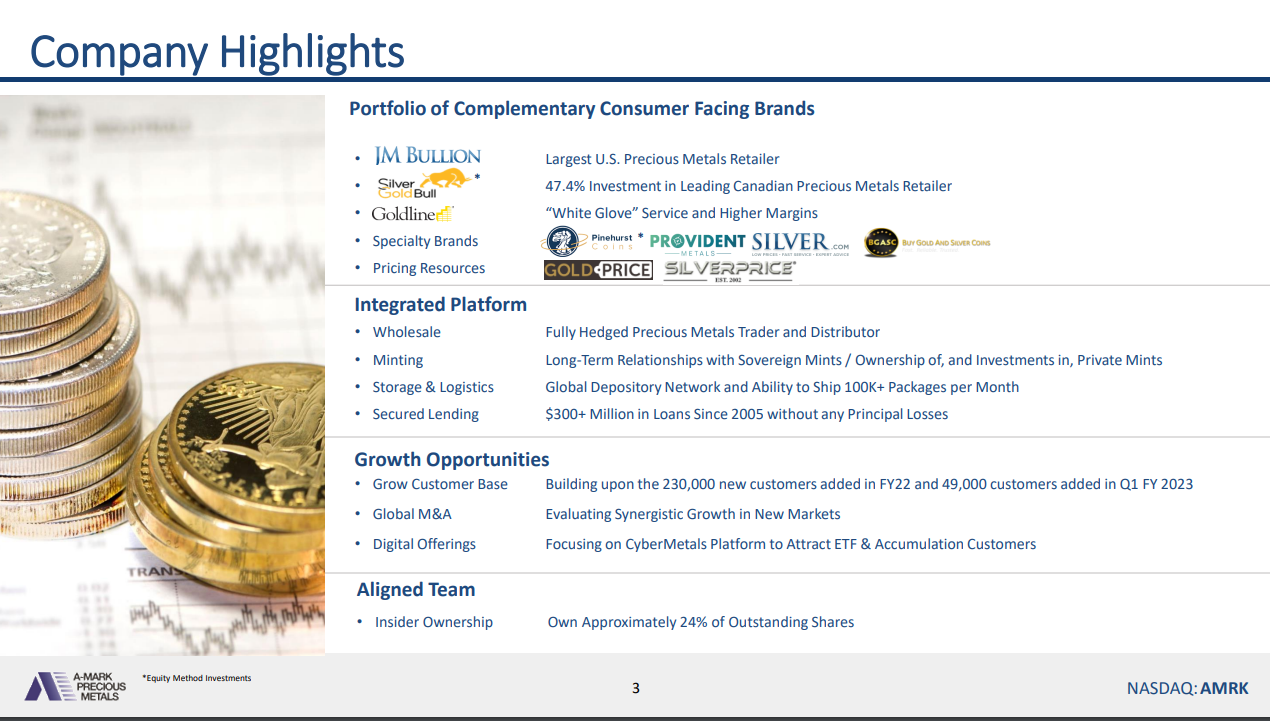
A-Mark has a number of brands that are consumer-facing, helping it to have a wide range of customers in a variety of markets. That diversification has helped the company produce a high level of growth during precious metal bull markets in the past. Given it operates as a wholesaler, profit margins are quite narrow. Indeed, that’s why its market cap is so small against its revenue total. That means A-Mark needs huge amounts of volume in order to generate profit growth, but it tends to perform quite strongly during bull markets for the metals it sells.
The stock’s beta value is -0.09, so like the others, it trades with essentially no correlation to the S&P 500. Like Cal-Maine, the stock has no dividend increase streak to speak of. It has paid variable dividends in recent quarters, including a per-share payment of 20 cents for January 2023. Should that level be maintained throughout the year, the stock would yield about 2.1%.
The valuation of A-Mark is quite attractive, trading for just seven times earnings. We therefore see downside risk as limited, but should gold and other precious metals continue their recent rally, upside could be sizable.
Final Thoughts
Beta is one of the most widely-used measures of stock market volatility. Beta can be a valuable tool for investors when analyzing stocks for inclusion in their portfolios.
Stocks with negative betas are expected to move inversely to the broader market. Negative-beta stocks could be particularly appealing in a recession or a market downturn.
Related:
Compound Your Wealth Like Warren Buffett | Snowball Effect Investing


