

There is a common myth termed ‘The January Effect,’ it is an assumption that there is a jump in share prices during the first month of the year. This is based on the assumption that Investors tend to sell losers out of their portfolio in December so that they can be taken as tax losses to offset capital gains throughout the year.
General optimism is another reason and investors may expect a positive outlook as they begin the New Year. The January effect is a consistent fools-gold errand and one that should be taken with the slightest pinch of salt if at all neglected. History has taught us that there is no ‘everybody-make-money-month’ and will never happen. The very act of everyone jumping ship on this calendar schedule destroys this endeavor.
Now let us look at the numbers.
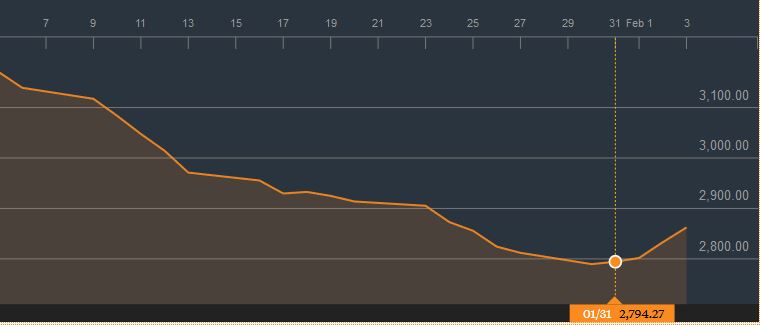
The NSE All share index dropped by 7.82% in January. The Benchmark NSE 20 Index (a composite of Kenyan blue chip companies) was down by 12.85% to stand at 2794.27 points for the month.
|
NSE Kenya Jan 2017 Equity Market Stats | |||
| January 2016 | January 2017 | % Gain/(Loss) | |
| No. of Deals | 26,857 | 17,638 | (34.32) |
| Monthly Volume | 422,010,700 | 540,813,400 | 28.15 |
| Monthly Value (KES) | 12,999,312,039 | 11,337,050,719 | (12.79) |
| Market Cap (KES Bn.) | 1,926.470 | 1,770.97 | |
| Market Cap (USD Mn.) | 18.826 | 17.056 | |
| Main Market P/E | 12.01 | 12.56 |
Number of deals on the NSE dropped by 34.32% in January 2017 compared to a similar period in the previous year. On the flip side volumes were up by 28.15% indicating better market participation compared to January 2016. Due to drop in market valuations, the value of shares traded on the NSE in January 2017 dropped by roughly KES 1.67 Billion compared to January 2016.
Top Monthly Gainers
In January only six counters emerged with a positive gain as the month concluded.
| Company | 3 Jan. 2017 VWAP | 31 Jan, 2017 VWAP | % Gain | Shares Traded (computed till Jan 27) | |
| 1. | E.African Portland Cement | 23.5 | 28.50 | +21.28 | 13,500 |
| 2. | Standard Group | 18.00 | 19.30 | +7.22 | 5,600 |
| 3. | Crown Paints | 42.00 | 45.00 | +7.14 | 20,400 |
| 4. | B.O.C Kenya | 83.00 | 88.50 | +6.63 | 9,200 |
| 5. | Umeme Ltd | 13.00 | 13.50 | +3.85 | 672,900 |
| 6. | Kakuzi | 280.00 | 286.00 | +2.14 | 38,600 |
Top Monthly Losers
| Company | 3 Jan 2017 VWAP | 31 Jan 2017 VWAP | % Loss | Shares Traded (computed till Jan 27) | |
| 1. | Sanlam plc | 27.75 | 18.00 | -35.14 | 29,300 |
| 2. | Eaagads | 27.75 | 21.00 | -24.32 | 28,700 |
| 3. | Britam | 12.60 | 9.55 | -24.21 | 3,946,500 |
| 4. | Uchumi Supermarkets | 3.75 | 2.85 | -24.00 | 326,300 |
| 5. | Kenya Commercial Bank | 29.00 | 23.00 | -20.69 | 34,860,100 |
| 6. | Equity Bank | 30.00 | 24.25 | -19.17 | 20,163,100 |
| 7. | CIC Insurance | 3.95 | 3.20 | -18.99 | 2,599,800 |
| 8. | Kenya Airways | 5.80 | 4.70 | -18.97 | 2,472,600 |
| 9. | Nation Media Group | 93.00 | 75.50 | -18.82 | 1,552,000 |
| 10. | Housing Finance | 13.65 | 11.10 | -18.68 | 533,300 |
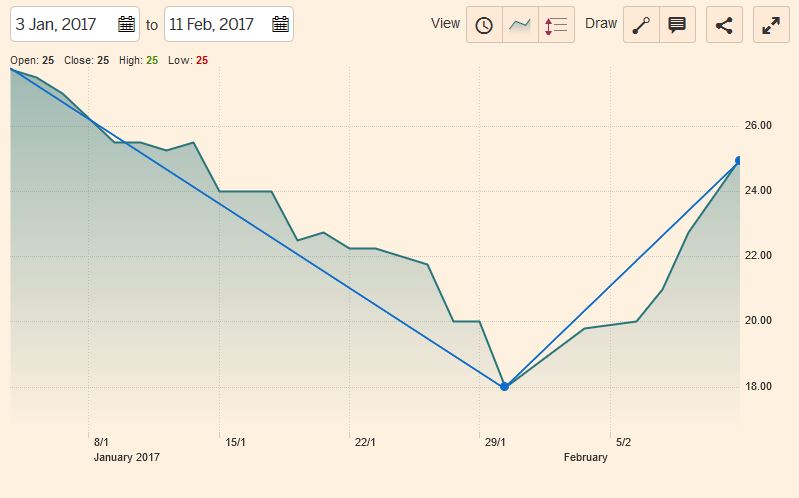
Sanlam Plc
Losers dominated January led by Sanlam plc which was triggered by a profit warning issued by the company end 2016 that led its shares on a free fall by roughly 35%. The insurance company later retracted back its profit warning in a statement issued on 9th Feb 2017 that has since seen some of its January losses reverted.
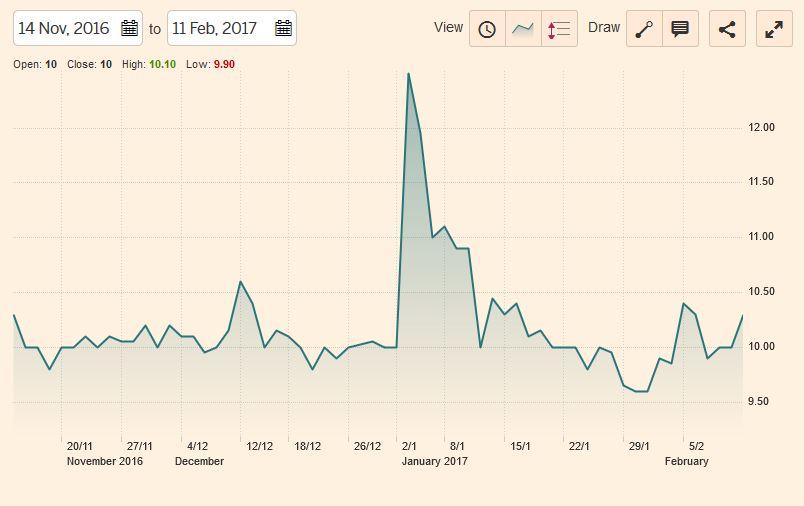
Britam Holdings
Britam Holdings another insurance company ended January on the red zone. As the year began Britam’s share price shot up by 20% after an announcement was made by the insurance company that World Bank is set to acquire a 10.37% stake for an estimated Ksh 3.5 Billion. The counter then sharply reversed to its normal three month trading horizon (three month chart below) to end January down by 24%.
Fixed Income Market
|
Debt Market Statistics | |||
| January 2016 | January 2017 | %increase/(decrease) | |
| Number of deals | 182 | 589 | 223.6 |
| Bond Turnover (KES) | 21,593,790,000 | 28,316,632,225 | 31.1 |
The debt market saw increased activity with number of deals up by an impressive 223.6% in Jan 2017 compared to Jan 2016 an indication of some investors shift to more relatively safer asset classes due to the continued hemorrhage in the Equities market.
The value of bonds traded in January 2017 was up by 31.1% to KES 28.3 Billion compared to KES 21.6 Billion in the previous year.
Conclusion
Let us see how the year will turn out. Great surprises are in the offing, risk management is key!
We wish our readers great portfolio out-performance in their emerging markets portfolios.
Sources of Data; NSE, FT, Bloomberg, Kenyan Wall Street


