Between 2006 and 2024, the banking sector’s market cap on the Nairobi bourse grew by 311.5%, as listed lenders outpaced their unlisted peers.
Kenya’s 11 listed banks have outperformed their unlisted counterparts over the past two decades, benefiting from improved access to capital, enhanced corporate governance, and greater investor confidence.
- •A detailed analysis shows that by listing on the Nairobi Securities Exchange (NSE), these banks tapped into public markets to raise capital, fueling their rapid expansion, digital transformation, and ability to withstand economic shocks.
- •The ability to issue shares, conduct rights offerings, and attract institutional investors has allowed listed banks to scale operations, strengthen their balance sheets, and improve profitability.
- •This access to capital has become even more critical following Kenya’s recent banking reforms, which mandate a tenfold increase in minimum core capital to KES 10 billion by 2029.
As smaller banks scramble to meet the new requirements—facing potential mergers, acquisitions, or capital injections—listed banks stand at a competitive advantage, already equipped with the tools to raise funds efficiently.
READ; HF Group Rights Issue Oversubscribed by 38.32%
How Listing Fueled Decades of Growth and Stability
Kenya’s banking sector has grown rapidly over the past two decades, driven by regulatory reforms, technological advancements, and evolving investor expectations.
According to the Central Bank of Kenya’s Bank Supervision Report 2006, there were 45 banking institutions that year, of which 41 were commercial banks, two were mortgage finance companies and one was a building society. The sector had total assets worth KSh 755.3bn, and made Ksh 27billion in profits that year. By 2023, the sector’s total net assets had grown to KSh 7.7 trillion, despite the number of commercial banks reducing to 38, and profits had grown to KSh 219bn.
Listed banks have been pivotal to this growth, as well as in promoting economic growth, financial inclusion, and capital market development.
1. Ranking by Performance
Among listed banks, Equity Group Holdings Plc emerged as the best performer, delivering a 236% gross capital gain since its listing. The banking sector has seen:
- •300+% growth in market capitalization, indicating strong investor confidence.
- •1,633% increase in total banking sector assets, reflecting significant expansion.
2. Revenue Growth Trends
The revenue performance of listed banks shows a steady upward trajectory for most, with Equity Group Holdings Plc and KCB Group Plc leading in total income growth.
- •Equity Group recorded a revenue increase of 5,117% over the period, far exceeding its peers.
- •KCB Group and NCBA Group Plc also demonstrated robust revenue growth.
Suggested Visualization: A line graph comparing revenue growth from 2006 to 2023.
| Year | Equity Group (KES) | KCB Group (KES) | NCBA Group (KES) | ABSA Bank (KES) | HF Group (KES) |
| 2006 | 3.5B | 12.5B | 2.8B | 16.6B | 1.2B |
| 2023 | 182.4B | 98.3B | 48.2B | 63.1B | 4.5B |
| Growth (%) | 5,117% | 686% | 1,621% | 280% | 275% |
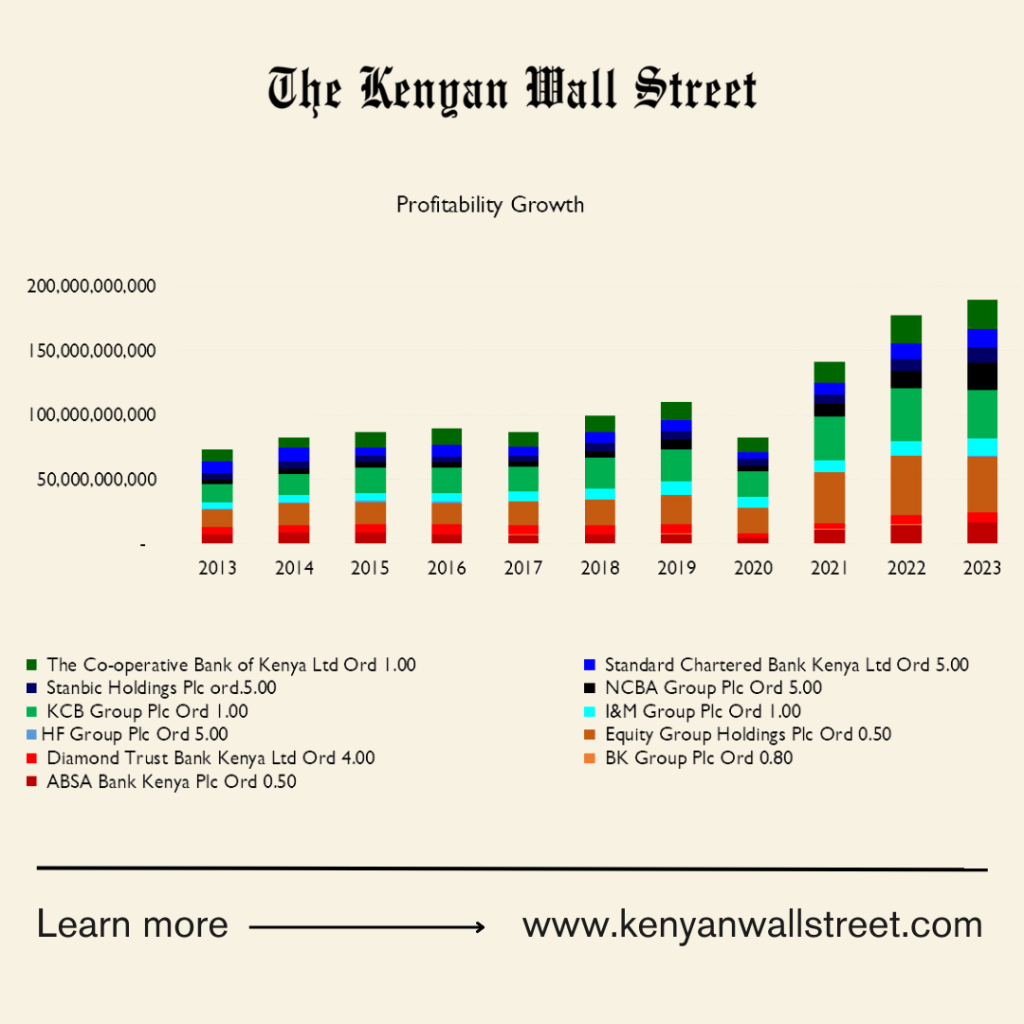
3. Profitability Trends
Profitability trends indicate a strong upward trajectory for most banks, particularly Equity Group Holdings Plc and KCB Group Plc.
- •Equity Group led the market in profit growth, rising from KES 753 million in 2006 to KES 36.6 billion in 2023.
- •KCB Group followed closely, recording KES 24.7 billion in net income by 2023.

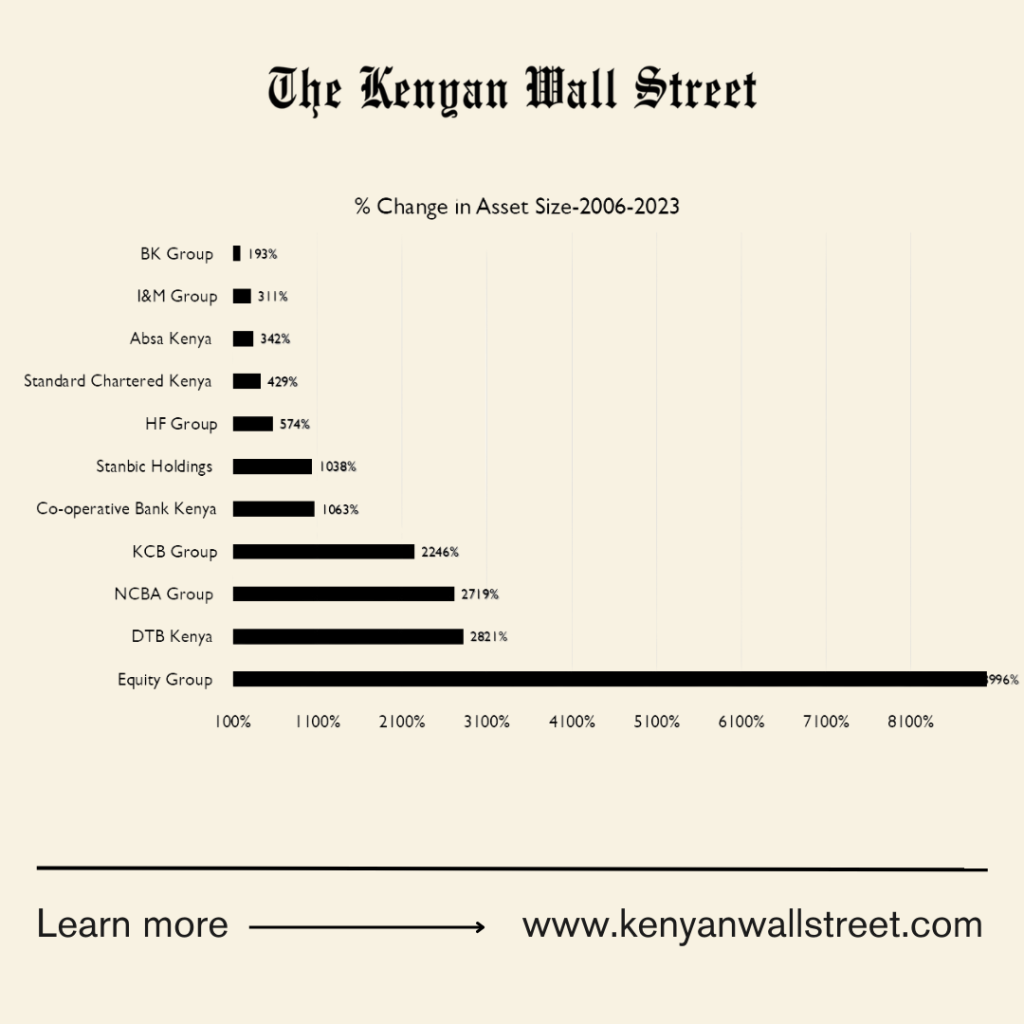
4. Total Asset Growth
The asset base of Kenyan banks has expanded significantly, with Equity Group Holdings Plc and KCB Group Plc emerging as leaders.
- •KCB Group became the largest bank by assets in 2023, surpassing KES 1.4 trillion.
- •Equity Bank followed closely with total assets of KES 1.2 trillion.
- •NCBA, Standard Chartered, and Co-operative Bank held significant positions in the mid-tier category.

| Year | KCB Group (KES) | Equity Group (KES) | NCBA Group (KES) | ABSA Bank (KES) | HF Group (KES) |
| 2006 | 92.5B | 20.0B | 26.0B | 117.7B | 9.1B |
| 2023 | 1.42T | 1.21T | 478B | 675B | 43.7B |
| Growth (%) | 1,435% | 5,950% | 1,738% | 473% | 380% |
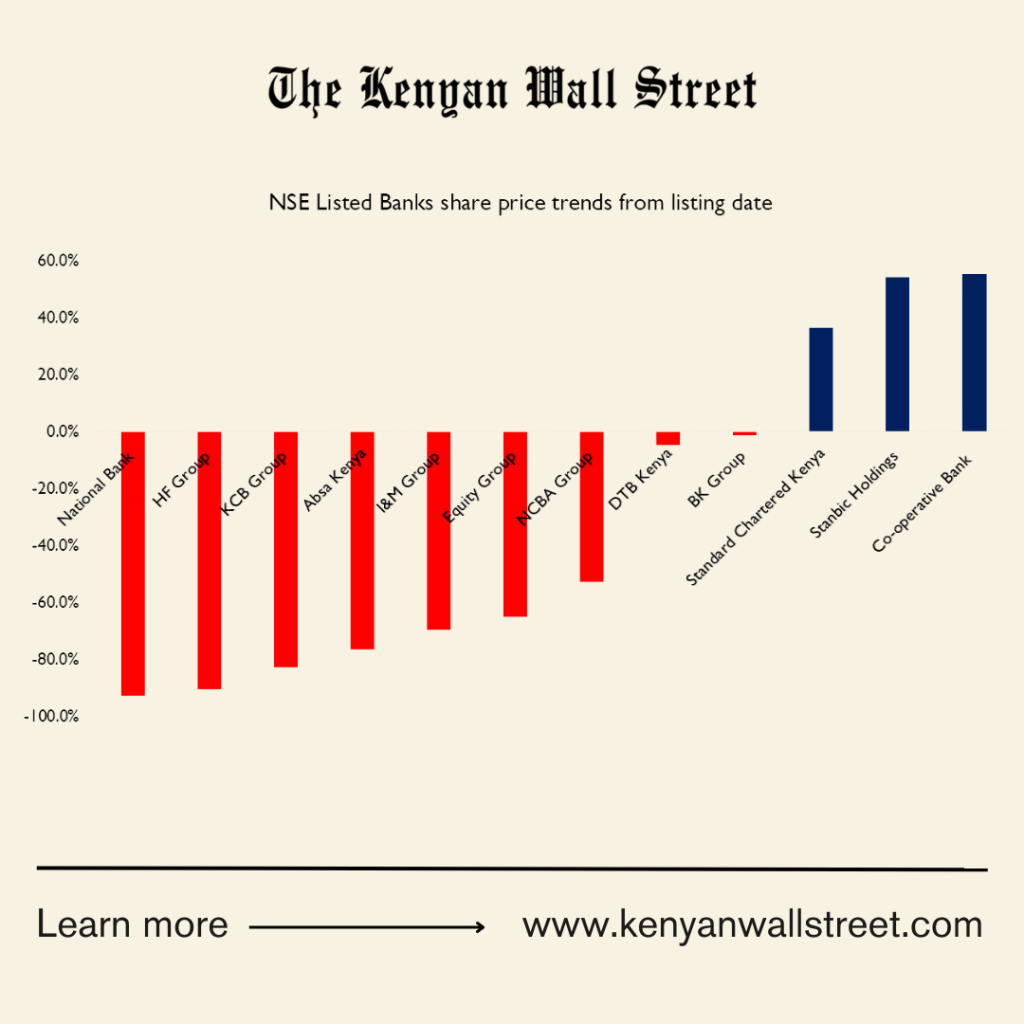
5. Investor Gains and Stock Price Performance
Over 18 years, listed banks have implemented several corporate actions, including bonus issues, share splits (by Equity Bank, Absa, and KCB), and rights issues, all of which have influenced stock prices.
- •Equity bank delivered the highest total capital gain of 236%.
- •Standard Chartered, Co-operative Bank and Stanbic Holdings also posted strong gains of 74.84%, 55.19% and 54.2%, respectively.
| Bank | 2006 Price (KES) | 2024 Price (KES) | % Change |
| Standard Chartered Kenya | 205.00 | 279.75 | 74.84% |
| Co-operative Bank | 10.60 | 16.45 | 55.19% |
| Stanbic Holdings | 89.00 | 137.35 | 54.2% |

6. Market Capitalization Growth
By the end of 2024, the banking sector accounted for 31% of the total market value of listed companies on the Nairobi Securities Exchange (NSE).
- •The sector’s market capitalization grew by more than 300% in 2006 to KES 880.6 billion in 2024, driven by stock price appreciation and additional share issuances.
- •Equity Bank now commands 21% of the total banking sector market capitalization, overtaking Absa.
ALSO READ; Kenya’s Stock Exchange Targets 9 Million Retail Investors in New 5-Year Strategy


