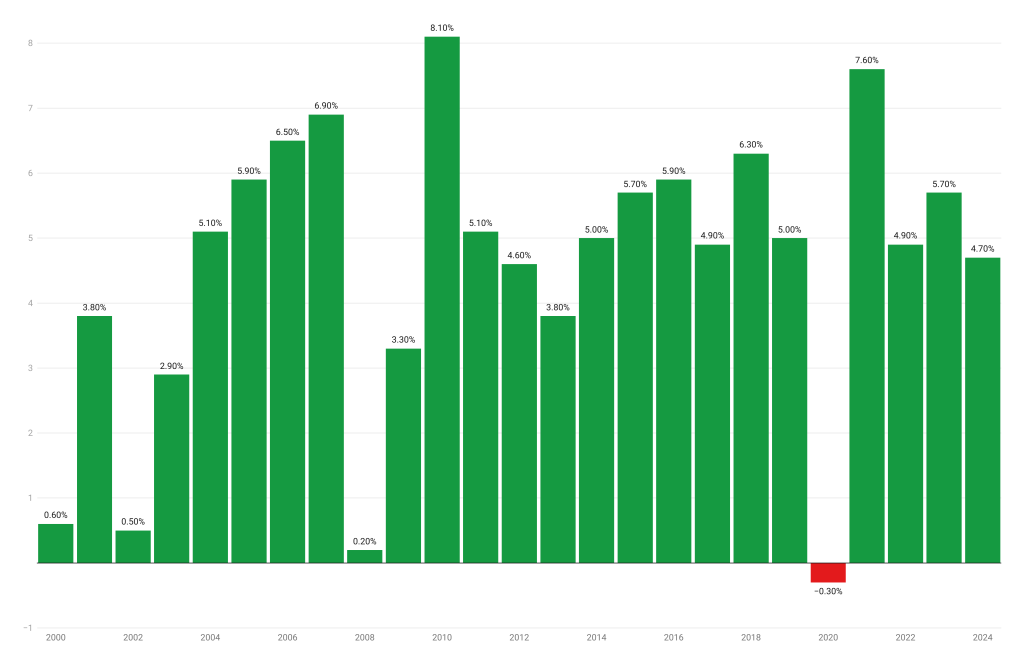
Kenya’s GDP expanded by 4.7% in 2024, a slowdown from 5.7% in 2023, as global headwinds, tight financial conditions, and easing post-pandemic momentum shaped economic activity.
- •While still positive, the pace of growth marked the slowest expansion since the pandemic-induced contraction of 2020, when the economy shrank by -0.3%.
Excluding that exceptional year, 2024 also registered the weakest annual growth since 2013, when GDP expanded by 3.8% amid post-election uncertainty and global economic pressures. - •Provisional data from the Economic Survey 2025 shows that the economy continues to be supported by solid consumer demand, recovering agriculture, and improving external balances.
Nominal GDP reached KSh 16.22 trillion, while real GDP (measured at 2016 prices) stood at KSh 10.91 trillion. Meanwhile, nominal GDP per capita crossed the KSh 300,000 mark for the first time, signaling continued national income gains.

While real GDP continues to grow, 2024 reflected a modest increase in living standards. Real GDP per capita stood at KSh 208,061, showing subdued inflation-adjusted gains.
Nominal GDP and Per Capita Indicators (2020–2024)
| Year | Nominal GDP (KSh Billion) | Real GDP (KSh Billion) | Real GDP Growth (%) | GDP Per Capita (KSh, Nominal) | GDP Per Capita (KSh, Constant) |
|---|---|---|---|---|---|
| 2020 | 10,715.1 | 8,733.1 | -0.3% | 219,492 | 178,892 |
| 2021 | 12,027.7 | 9,395.9 | 7.6% | 241,907 | 188,976 |
| 2022 | 13,489.6 | 9,852.6 | 4.9% | 266,473 | 194,627 |
| 2023 | 15,033.6 | 10,416.2 | 5.7% | 291,770 | 202,155 |
| 2024* | 16,224.5 | 10,908.3 | 4.7% | 309,460 | 208,061 |
*2024 data provisional.
The composition of Kenya’s GDP last year reveals some important shifts. Agriculture rebounded strongly, while services — particularly transport and finance — remained resilient. Manufacturing and construction, however, struggled.
GDP by Sector: Contribution to Nominal GDP (2020–2024)
| Sector | 2020 | 2021 | 2022 | 2023 | 2024* |
|---|---|---|---|---|---|
| Agriculture, Forestry and Fishing | 22.7% | 21.5% | 21.0% | 21.5% | 22.5% |
| Transportation and Storage | 10.8% | 11.6% | 13.2% | 13.2% | 12.7% |
| Real Estate | 9.3% | 9.0% | 8.5% | 8.4% | 8.4% |
| Financial and Insurance Activities | 6.7% | 7.2% | 7.4% | 7.8% | 7.9% |
| Wholesale and Retail Trade | 8.1% | 7.9% | 7.7% | 7.7% | 7.5% |
| Manufacturing | 7.6% | 7.4% | 7.7% | 7.5% | 7.3% |
| Construction | 7.0% | 7.1% | 7.1% | 6.7% | 6.3% |
| Public Administration and Defence | 5.5% | 5.3% | 5.0% | 4.9% | 5.0% |
| Others (combined) | 22.3% | 22.9% | 22.4% | 20.3% | 21.4% |
*2024 data provisional.
Kenya’s GDP remains consumption-driven economy with private consumption accounting for 76.9% of GDP in 2024.
GDP by Expenditure Approach (2020–2024)
| Expenditure Category | 2020 | 2021 | 2022 | 2023 | 2024* |
|---|---|---|---|---|---|
| Government Consumption | 12.5% | 12.1% | 12.2% | 11.8% | 11.2% |
| Private Consumption | 75.4% | 74.6% | 74.9% | 76.2% | 76.9% |
| NPISH Consumption | 1.0% | 0.9% | 0.8% | 0.7% | 0.7% |
| Gross Fixed Capital Formation | 19.3% | 19.7% | 18.6% | 17.5% | 17.5% |
| Changes in Inventories | 0.3% | 0.7% | 0.4% | -0.9% | -0.8% |
| Exports | 11.4% | 13.1% | 16.0% | 16.9% | 17.1% |
| Imports | -19.0% | -21.9% | -24.3% | -24.2% | -23.1% |
| Statistical Discrepancy | -1.1% | 0.7% | 1.4% | 2.0% | 0.5% |
| GDP | 100% | 100% | 100% | 100% | 100% |
*2024 data provisional.
Investment in dwellings and transport equipment led capital formation while industrial investment remained subdued.
Gross Fixed Capital Formation by Asset Type (2020–2024)
| Asset Type | 2020 | 2021 | 2022 | 2023 | 2024* |
|---|---|---|---|---|---|
| Dwellings | 32.4% | 33.0% | 34.2% | 34.4% | 33.1% |
| Other Buildings | 10.5% | 10.7% | 11.0% | 11.0% | 10.6% |
| Other Structures | 28.7% | 26.7% | 29.1% | 28.3% | 25.7% |
| Transport Equipment | 10.6% | 12.9% | 10.1% | 9.5% | 13.1% |
| ICT Equipment | 4.5% | 4.1% | 4.2% | 4.3% | 4.7% |
| Other Machinery | 11.5% | 11.1% | 10.1% | 10.3% | 10.7% |
| Others (combined) | 1.8% | 1.5% | 1.3% | 2.2% | 2.1% |
*2024 data provisional.
Kenya’s 2024 performance reflects resilience but also growing challenges. Key risks include:
- •Softening global growth and potential export weakness.
- •Heavy reliance on private consumption.
- •Subdued industrial investment.
However, recovery in agriculture, services dynamism, and improving external balances offer reasons for cautious optimism.


