Kenya’s Collective Investment Schemes (CIS) reached a new milestone in Q2 2025, with total Assets Under Management (AUM) rising to KSh 596.3 billion, a 20.2% increase from KSh 496.2 billion at the end of March.
- •Since Q1 2018, the sector assets have expanded more than tenfold, underscoring its growing importance in Kenya’s financial system.
- •Fixed deposits surged 43.9% to KSh 210.5 billion, while offshore listed investments more than doubled to KSh 50.3 billion between March and June 2025.
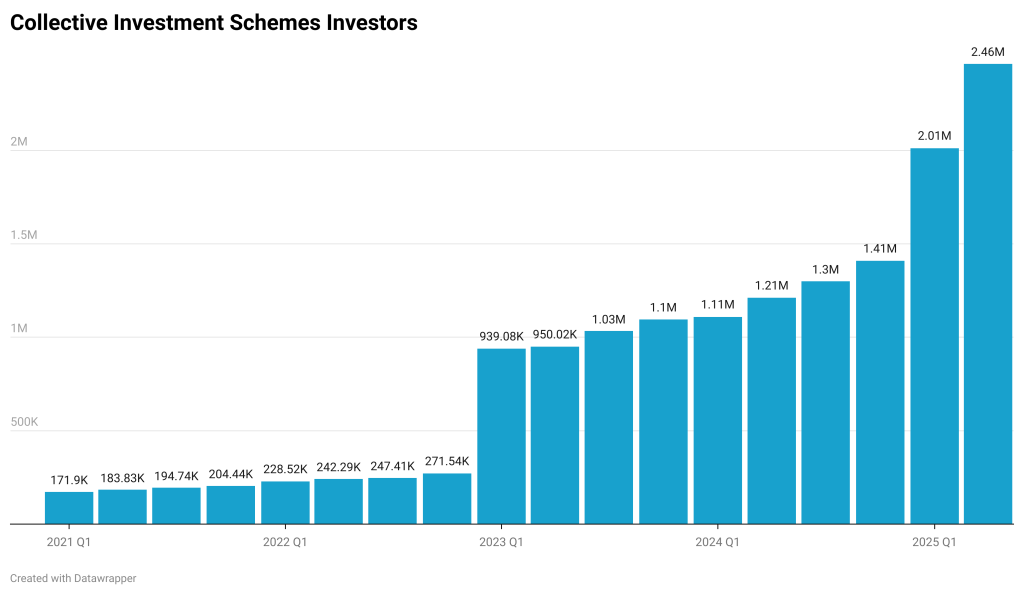
- •Investor accounts rose to 2.46 million in Q2 2025, up 22.4% from 2.01 million in Q1, having risen by more than fourteen fold from only 171, 904 investors four years ago.
Securities issued by the government of Kenya still get the largest allocation at KSh 244.2 billion, accounting for 41% of assets.
| Asset Class | Q2 2025 (KSh Bn) | Q1 2025 (KSh Bn) | Proportion | QoQ Change (%) |
|---|---|---|---|---|
| Securities Issued by GOK | 244.16 | 229.72 | 41% | 6.3 |
| Fixed Deposits | 210.49 | 146.30 | 35% | 43.9 |
| Cash & Demand Deposits | 58.78 | 72.24 | 10% | -18.6 |
| Off-shore Listed Investments | 50.29 | 19.26 | 8% | 161.1 |
| Unlisted Securities | 17.08 | 13.66 | 3% | 25.1 |
| Listed Securities | 6.20 | 7.16 | 1% | -13.4 |
| Alternative Investments | 4.80 | 4.30 | 1% | 11.7 |
| Other Collective Investment | 3.06 | 2.29 | 1% | 33.4 |
| Off-shore Unlisted | 1.49 | 1.29 | 0% | 15.1 |
| TOTAL | 596.34 | 496.21 | 100% | 20.2 |
Cash and demand deposits fell 18.6% to KSh 58.8 billion, while unlisted securities, alternative investments, and other collective schemes recorded moderate increases.

Top Unit Trust Schemes
Sanlam Unit Trust set a record in Q2 2025, becoming the first Kenyan CIS to exceed KSh 100 billion in AUM.
- •Its portfolio rose to KSh 113.7 billion, more than sixteen times higher than in Q1 2021, reflecting a 202% year-on-year increase.
- •Sanlam now leads the market with a 19.1% share, followed by CIC Unit Trust (15.7%), Standard Investment Bank Unit Trust Funds (12.9%), NCBA Unit Trust (9.5%), and Britam Unit Trust (6.9%).
- •Combined, these five schemes account for nearly two-thirds of total industry assets.
| Unit Trust Scheme | Jun-25 (KSh Bn) | Mar-25 (KSh Bn) | Change (%) |
| Sanlam Unit Trust Scheme | 113.65 | 90.22 | 26% |
| CIC Unit Trust Scheme | 93.37 | 87.54 | 7% |
| Standard Investment Trust | 77.04 | 56.84 | 36% |
| NCBA Unit Trust Scheme | 56.50 | 49.95 | 13% |
| Britam Unit Trust Scheme | 41.15 | 34.36 | 20% |
Performance by Fund Category
Among CIS categories, Money Market Funds (MMFs) are still the dominant choice, holding KSh 372.8 billion in Q2 2025 and accounting for 62.5% of industry assets. Special Funds followed with KSh 113.4 billion (19%), while Fixed Income Funds accounted for KSh 105.6 billion (17.7%). Equity and Balanced Funds trailed with 0.5% and 0.3% shares respectively.
Special Funds recorded the fastest growth, rising 31% quarter-on-quarter. Fixed Income Funds grew 23%, Money Market Funds expanded 17%, Equity Funds rose 16%, and Balanced Funds increased 5%.
| Fund Type | Jun-25 (KSh Bn) | Mar-25 (KSh Bn) | Change (%) | Share of AUM |
| Money Market Fund | 372.81 | 319.75 | 17% | 62.5% |
| Special Fund | 113.39 | 86.68 | 31% | 19.0% |
| Fixed Income Fund | 105.63 | 85.75 | 23% | 17.7% |
| Equity Fund | 2.89 | 2.49 | 16% | 0.5% |
| Balanced Fund | 1.63 | 1.55 | 5% | 0.3% |
| TOTAL | 596.34 | 496.21 | 20% | 100% |


