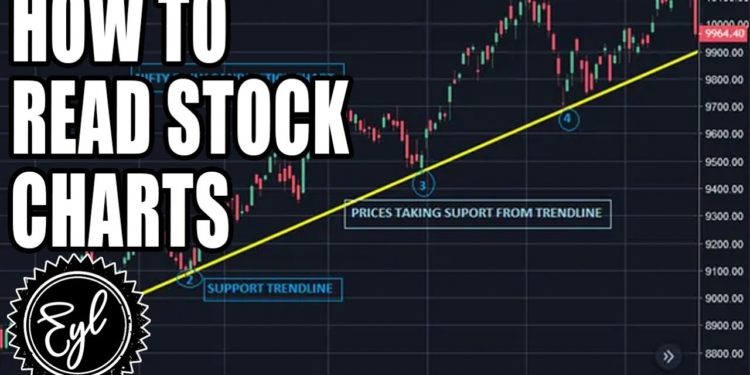
Stock price charts often seem to be complex looking at them for the first time, but don’t worry, let me give you your first lesson. Investors in the Financial markets use two types of analysis to make their investment decisions. We have Fundamental analysis and Technical analysis. Fundamental analysis involves looking at factors such as the macroeconomic environment, financial statements, and the leadership of a company. On the other hand, Technical analysis involves looking at historical data which entails looking at stock charts to determine where the price might be headed in the future. Let’s get started on Technical Analysis.
A stock price chart has two major elements. Price and time. Price movement is mostly indicated using JAPANESE CANDLESTICKS. Let’s now look at JAPANESE CANDLESTICKS.
Candlesticks are believed to have been invented by a Japanese rice trader to assist him in his trading activities. They were later adopted in the western world hence becoming more popular. Before we start let me define some terms:
Bullish trend – This means the stock price is going up
Bearish trend – This means the stock price is going down
Let’s now look at the anatomy of a candlestick.

Every candlestick represents price movement in a specific period, e.g., 5, 15, 30 minutes, Daily, and monthly timeframes.

Let’s say the green candle was in a daily price chart. For a green/ Bullish candle, the bottom part will represent the opening price on that day, the upper part will represent the closing price on that day. THIS IS BECAUSE PRICE MOVED UPWARDS during that day. For a red/ Bearish candle, the upper part will represent the opening price on that day, the lower part will represent the closing price on that day. THIS IS BECAUSE PRICE MOVED DOWNWARDS during that day.

Sometimes candlesticks have “tails” instead of a full body. Basically, the upper tail shows the highest price the share reached during that trading period e.g., 15 min, 30 min, or even the day. This means the price reached that level but it closed below it and vice versa. During the day, Safaricom’s share price might reach 27 Ksh per share but ends up closing at 25.60 Ksh. The end of the tail will be at 27 Ksh but the top of the body of the candlestick will be at 25.60 Ksh. It’s as easy as that.

We also have a special type of candlestick known as a Doji. This is a candlestick that has no body. This means that the price sort of remained around the same place where it had opened.

TRADING TIP!! A DOJI IN SOME CASES SIGNIFIES THE END OF A TREND. IF SAFARICOM SHARE PRICE HAS BEEN IN AN UPTREND FOR A LONG PERIOD AND YOU SEE A DOJI, THAT MAY BE A SIGN THAT THE PRICE IS ABOUT TO SHIFT TO A DOWNTREND.
HAPPY TRADING!!
Want to Become a Pro Trader? Here’s How to Learn and Follow the Best!
Investing 101: Answering the Question: Why Should I Invest?


