HF Group has delivered a standout performance in the first quarter of 2025, reporting a profit after tax of KSh 327.9 million—its highest Q1 result on record.
- •This marks a 118% increase from KSh 150.3 million in Q1 2024 and reflects sustained improvements in core banking operations.
- •The lender, founded in 1965 as a mortgage lender, net interest income rose by 46.2% year-on-year to KSh 989.8 million.
- •This improvement was driven by higher loan yields and better funding cost management.
Additionally, non-interest income grew by 9.9% to KSh 425.0 million. Total operating income increased by 33.0%, reaching KSh 1.41 billion.
| Metric | Q1 2025 | Q1 2024 | YoY Change |
|---|---|---|---|
| Net Interest Income | KSh 989.8 Mn | KSh 677.3 Mn | +46.2% |
| Non-Interest Income | KSh 425.0 Mn | KSh 386.6 Mn | +9.9% |
| Total Operating Income | KSh 1.41 Bn | KSh 1.06 Bn | +33.0% |
| Profit Before Tax (PBT) | KSh 336.5 Mn | KSh 158.7 Mn | +111.9% |
| Profit After Tax (PAT) | KSh 327.9 Mn | KSh 150.3 Mn | +118.2% |
| Customer Deposits | KSh 50.1 Bn | KSh 43.8 Bn | +14.5% |
| Total Assets | KSh 73.4 Bn | KSh 62.8 Bn | +16.8% |
| Net Loans & Advances | KSh 38.9 Bn | KSh 38.1 Bn | +2.0% |
HF Group CEO Robert Kibaara attributed the performance to the Group’s strategic shift and capital strengthening.
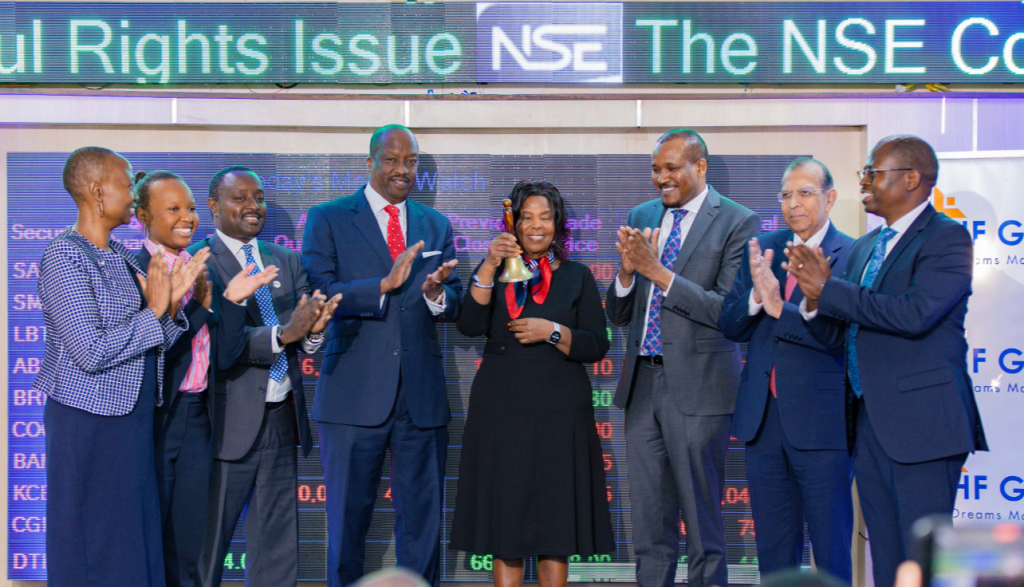
“We continue to realize the impact of our transformation journey. Our business model has evolved significantly, enabling us to deliver sustainable growth and value to our shareholders. Further, the successful rights issue, which was oversubscribed by 38%, has enhanced our capital position, allowing us to power growth as we innovate to meet customer needs,”
said Kibaara.
Late 2024, HF Group raised KSh 6.0 billion in gross proceeds, with a subscription rate of 138.32%. The offer, priced at KSh 4.00 per share, issued two new shares for every one held and received applications for nearly 1.6 billion shares against a target of 1.5 billion.

Historical Context: Recovery After Years of Losses
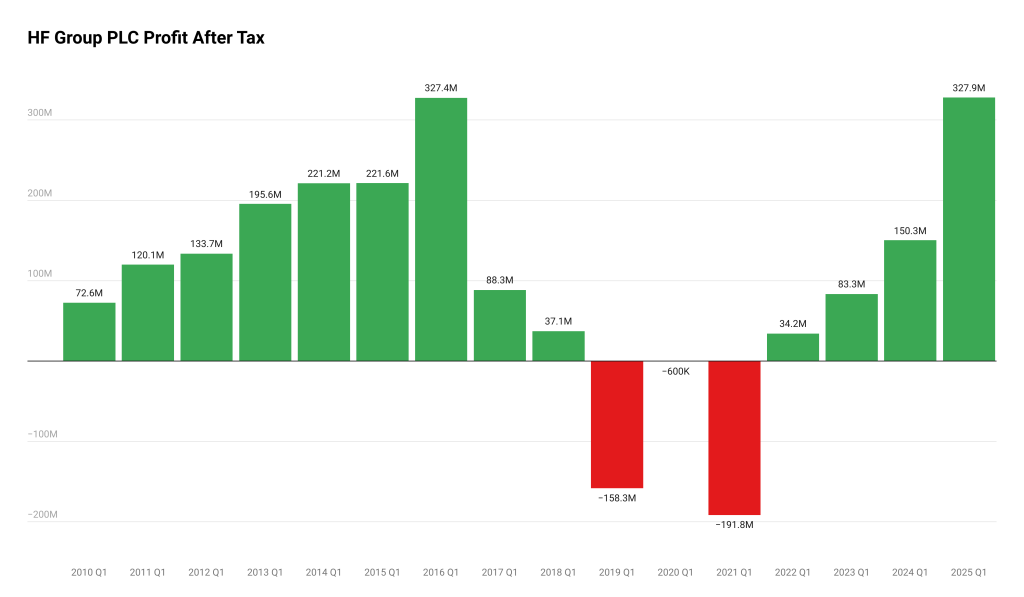
The Q1 2025 result caps a multi-year recovery for HF Group. Between 2019 and 2021, the Group reported three consecutive Q1 losses. The lowest point was in Q1 2021 with a loss of KSh 191.8 million.

This trend confirms the Group’s return to sustained profitability. The 2025 figure surpasses the previous record of KSh 327.4 million posted in 2016.
Strengthening the Balance Sheet
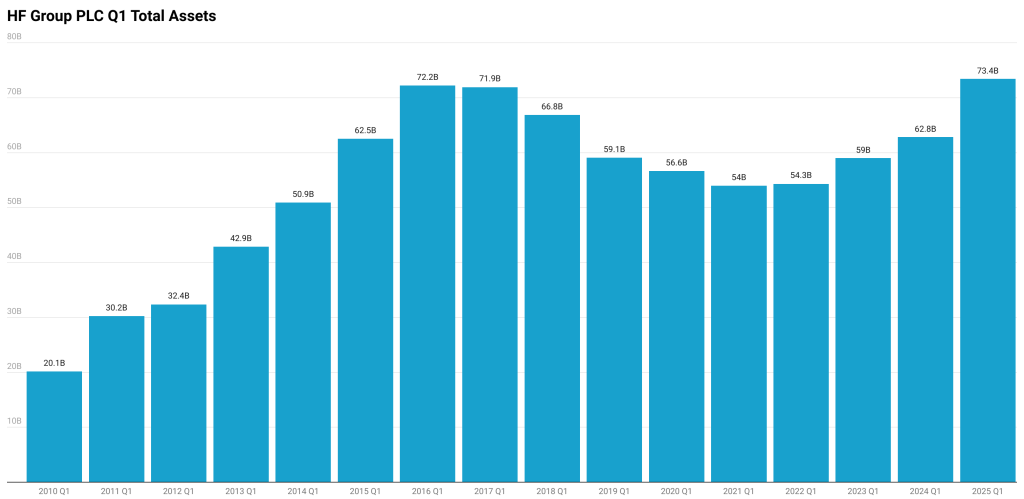
HF Group has successfully rebuilt its balance sheet. From a low of KSh 53.95 billion in total assets in Q1 2021, the figure has risen to KSh 73.4 billion in Q1 2025—its highest ever first-quarter asset level.
Customer deposits have also increased from KSh 37.2 billion in 2021 to over KSh 50 billion, reflecting renewed investor and depositor confidence.

Although gross loans have remained relatively flat, the Group has emphasized credit quality and income diversification. Business banking, real estate investments, and custodial services are contributing to a more balanced revenue mix.
HF Group Q1 Financials (2010–2025)
Values: Income in KSh Mn | Balance Sheet in KSh Bn
| Metric | Q1 2010 | Q1 2011 | Q1 2012 | Q1 2013 | Q1 2014 | Q1 2015 | Q1 2016 | Q1 2017 |
|---|---|---|---|---|---|---|---|---|
| Net Interest Income | 328.4 | 434.6 | 456.4 | 665.1 | 652.1 | 782.5 | 1,001.8 | 797.6 |
| Non-Interest Income | 49.1 | 63.2 | 65.1 | 79.1 | 217.9 | 168.5 | 241.8 | 172.8 |
| Operating Income | 377.4 | 497.8 | 521.5 | 744.2 | 869.9 | 951.0 | 1,243.6 | 970.5 |
| Profit Before Tax | 103.6 | 171.6 | 190.9 | 279.9 | 316.0 | 279.8 | 470.5 | 129.4 |
| Profit After Tax | 72.6 | 120.1 | 133.7 | 195.6 | 221.2 | 221.6 | 327.4 | 88.3 |
| Total Assets | 20.13 | 30.22 | 32.37 | 42.86 | 50.88 | 62.52 | 72.23 | 71.91 |
| Customer Deposits | 13.62 | 16.63 | 18.74 | 24.55 | 28.52 | 33.07 | 40.87 | 38.26 |
| Gross Loans & Adv | 15.35 | 20.37 | 26.46 | 31.69 | 37.25 | 47.69 | 53.45 | 54.60 |
| Gross NPLs | 1.91 | 1.67 | 1.50 | 2.68 | 3.58 | 3.87 | 7.78 | 7.78 |
| Metric | Q1 2018 | Q1 2019 | Q1 2020 | Q1 2021 | Q1 2022 | Q1 2023 | Q1 2024 | Q1 2025 | CAGR (2010–2025) |
|---|---|---|---|---|---|---|---|---|---|
| Net Interest Income | 697.2 | 510.8 | 580.7 | 474.3 | 520.1 | 629.4 | 677.3 | 989.8 | 7.63% |
| Non-Interest Income | 283.7 | 258.7 | 253.5 | 135.0 | 252.7 | 274.7 | 386.6 | 425.0 | 15.47% |
| Operating Income | 980.9 | 769.5 | 834.2 | 609.3 | 772.8 | 904.1 | 1,063.9 | 1,414.7 | 9.21% |
| Profit Before Tax | 52.9 | -157.7 | 7.0 | -178.4 | 39.1 | 90.0 | 158.7 | 336.5 | 8.17% |
| Profit After Tax | 37.1 | -158.3 | -0.6 | -191.8 | 34.2 | 83.3 | 150.3 | 327.9 | 10.57% |
| Total Assets | 66.84 | 59.08 | 56.63 | 53.95 | 54.30 | 58.99 | 62.82 | 73.40 | 8.14% |
| Customer Deposits | 35.91 | 33.99 | 37.99 | 37.20 | 38.35 | 41.21 | 43.76 | 50.11 | 9.61% |
| Gross Loans & Adv | 48.78 | 41.99 | 38.41 | 35.77 | 34.81 | 36.97 | 38.13 | 38.87 | 6.09% |
| Gross NPLs | 8.48 | 12.97 | 12.22 | 10.51 | 8.43 | 8.78 | 11.20 | 11.96 | 11.74% |


