

This is a guest contribution by Lyn Alden for SureDividend
The sharp rise in US Treasuries yields over the past year has put downward pressure on many growth-oriented equities, while dividend-focused equities have generally held up better.
Any investment, when determining its approximate fair value, must be compared to something else. For equities, that “something else” is often the 10-year US Treasury yield, which is thought of by many investors as the benchmark nominally risk-free savings asset.
From there, there are many ways to value an equity. For example, someone could do extensive discounted cash flow analysis, and use the sum of the 10-year yield and an equity risk premium as their discount rate. Alternatively, someone could compare the earnings yield of a stock to the 10-year Treasury yield. For income-focused investors, comparing the dividend yield of stocks you want to buy to the 10-year yield is one of the simpler methods.
Historically, the 10-year Treasury yield has usually offered a higher yield than blue chip dividend growth stocks, but this came at the cost of the coupon not growing during its duration.
You can download the complete list of all 350+ blue-chip stocks (plus important financial metrics such as dividend yield, P/E ratios, and payout ratios) by clicking below:

In other words, an investor could get maybe a 5% yield from Treasuries, or a 3% yield from some of the highest-quality stocks, with the difference being that a stock could be expected to grow its dividend by 5-15% per year over that holding period, resulting in more total income and more capital appreciation than the Treasury note in exchange for more volatility and a risk of capital loss.
However, in this modern environment of ultra-low rates, this dynamic became flipped. I’ll illustrate with three quintessential dividend champions, each with at least 60 years of consecutive annual years of dividend growth under their belt.
Procter & Gamble vs. The 10-Year Yield
This chart shows the spread between Procter & Gamble’s (PG) dividend yield and the 10-year Treasury yield:
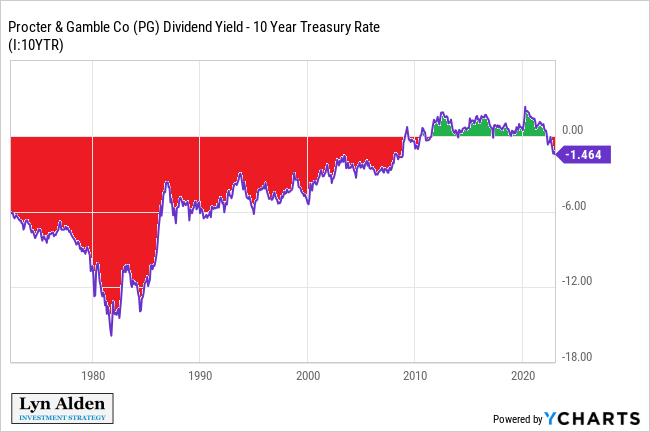
As we can see, the spread was negative most of the time, meaning that PG’s dividend yield was lower than the US Treasury yield. This is what we would expect, since the Treasury note is a pure savings and income asset while PG is a combined income-and-growth asset.
However, the 2010s decade was a weird one- the dividend yield was higher than the 10-year Treasury yield. An investor could get more income *and* more growth with the stock than the bond!
I consider this era to have been a bond bubble- many equities were reasonably-valued during much of the decade, while bonds were overvalued.
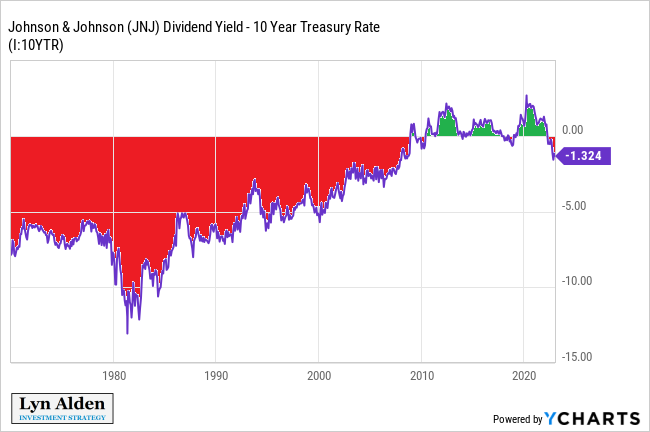
Two More Examples
Johnson & Johnson (JNJ)’s yield spread relative to the 10-year shows the same pattern:
We can see the same dynamic with Coca-Cola (KO):
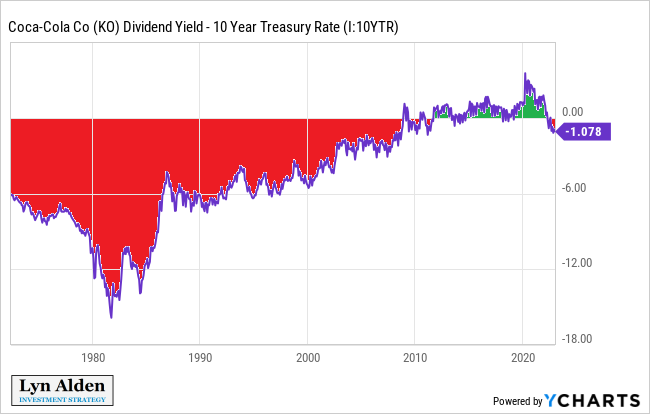
There are dozens of other stocks with charts like this. For the majority of companies with 40+ years of consecutive annual dividend growth, their yields were below the Treasury rate until the 2010s decade, and only recently have they returned to that state.
The Takeaway
During the 2010s decade, equities were a slam-dunk better place to put capital than Treasuries. Sticking with dividend stocks rather than bonds provided more current income plus more growth, which was historically unusual.
In the 2020s decade, the situation seems to be returning to some degree of normalcy. Many dividend champions now yield lower than the 10-year Treasury note, as they should. However, the spread is still rather small compared to history, meaning that the combination of income and growth offered by these types of stocks is still generally compelling compared to Treasuries for investors with a long-term view.
Broad stock investors should plan for lower expected returns over the next decade compared to the prior decade, because many equity valuations are higher now than they were when they started the 2010s decade, both in absolute terms and relative to Treasuries.
However, dividend equities in general are still by no means expensive relative to Treasuries, even if they’re not quite as cheap as they were a decade ago. Through careful stock selection, avoiding the most overvalued securities, and focusing on out-of-favor high-quality companies, there is still plenty of opportunity in the dividend stock universe compared to Treasuries.
This article was first published by Lyn Alden for Sure Dividend
Sure dividend helps individual investors build high-quality dividend growth portfolios for the long run. The goal is financial freedom through an investment portfolio that pays rising dividend income over time. To this end, Sure Dividend provides a great deal of free information.
Related:


