The Business Daily newspaper has been running the same commodity and NSE market graphs for over six months, inaccurately depicting the prices of commodities such as gold and tea and misrepresenting the Nairobi Securities Exchange’s indices.
- •Failures to provide accurate graphs in its print edition of Business Daily include depictions of the NSE All-Share, NSE 25-Share, NSE 20-Share, and NSE Market Cap index graphs often found on page 16 in addition to commodity price graphs for Gold, Brent Crude, Copper, Wheat, and Tea, often found on page 18.
- •These inaccuracies in market data visualization could lead to investors losing billions in hard earned money by fuelling uninformed investment decisions among readers.
- •Nation Media Group (Ticker: NMG), a publicly listed company on the Nairobi Securities Exchange and cross-listed on the Uganda, Dar es Salaam, and Kigali exchanges, publishes several brands including Business Daily, The East African, Daily Nation, and NTV.
While most traders are unlikely to make trades solely on out-dated, printed graphs in a newspaper, this lack of oversight in accurately depicting key markets raises significant questions about the relevance of physical newspapers in today’s digital economy.
Issues with Commodity Price Visualizations
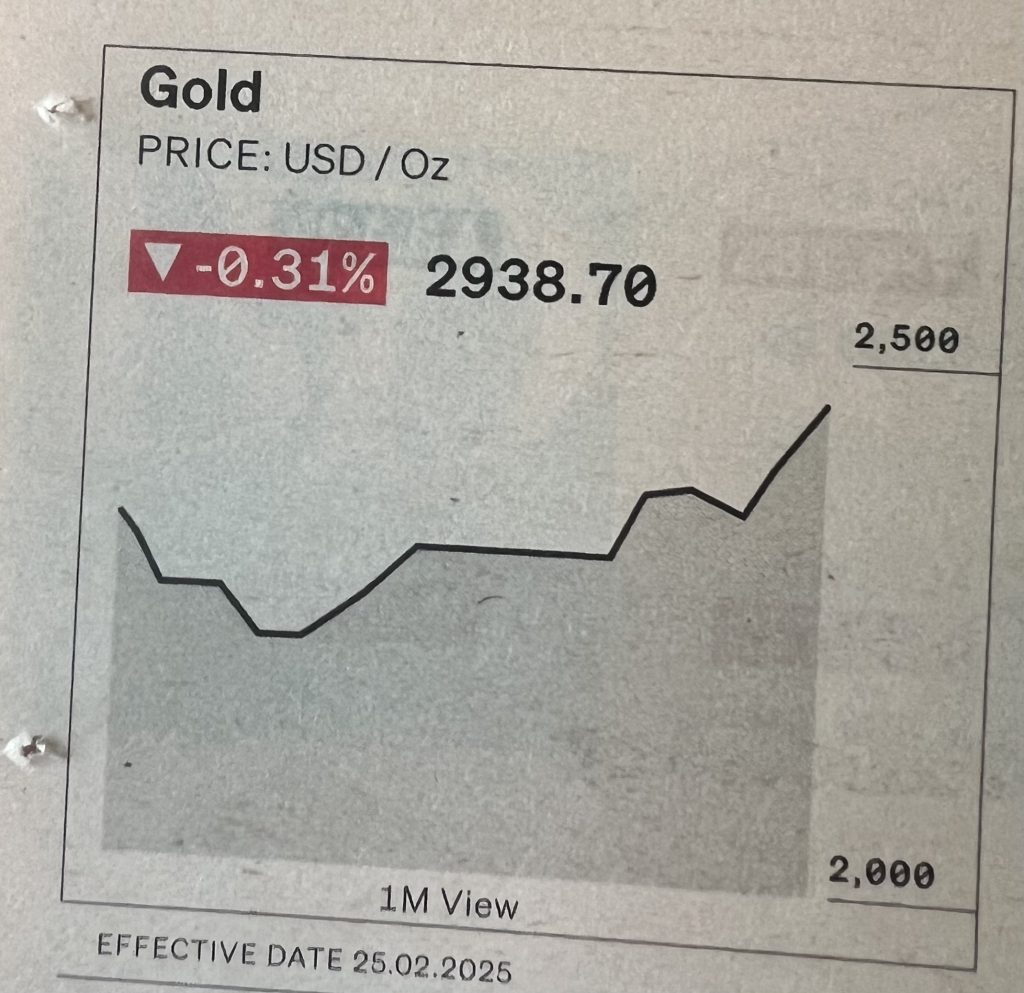
In the Wednesday, February 26 2025 edition, the Gold, Brent Crude, Copper, and Wheat graphs were exactly the same, and the scaling figures and timeframes do not make sense.
If the price of Gold is $2,938.70, why is the graph directly below it showing that the gold USD/OZ price is below $2,500? To give credit where it is due, BD has accurately depicted the price of Gold USD/OZ on the effective date indicated. However, the supposed one month view graph depicts a price more aligned with the state of the gold market around July 2024, rather than current prices.
For nearly 7 months now, since July 26, 2024, the publication has printed the same exact charts, using them as if they are clip art rather than appropriate data visualizations. Further, on any day in the last 7 months, you can open page 18 of the paper and see that Gold, Brent Crude, Copper, and Wheat all have the same exact graph, as if each of these commodities are perfectly correlated.
Imagine if you are a commodities or futures trader and you rely on newspapers to make your investment decisions, then inaccuracies such as this have the potential to skew your decisions, and lead to loss of billions in capital from making misinformed decisions.
According to inside sources at NMG, editorial teams are reportedly bogged down, often working on multiple productions simultaneously while also pulling long hours, which explain why this oversight has gone on for so long.
The Kenyan Wall Street has reached out to both Business Daily and its parent company NMG for comment but had not heard back from them at the time of publication.
Issues with NSE Data Visualizations
The issue goes deeper than simply commodities, Business Daily is also a disservice to its parent company’s own bourse, the Nairobi Securities Exchange, by pairing the correct daily data points with outdated graphs which could cause investors to potentially make further misinformed investment decisions.
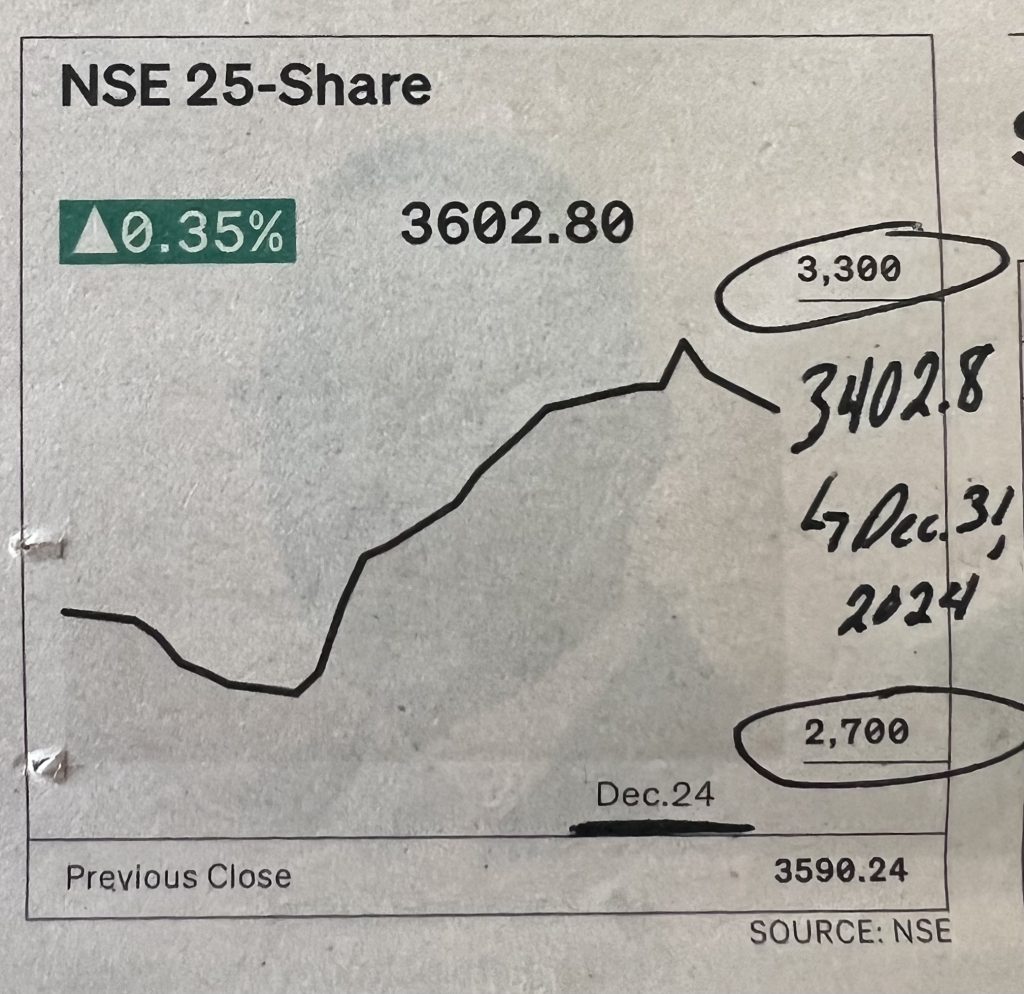
Allow us to investigate the NSE 25-Share index chart printed on Wednesday, February 26, 2025. This figure tells us that the index closed on the preceding day at 3602.80 which accurately depicts the number issued in the NSE Market Report for that day, however the graph claims to end in December 2024.
According to NSE markets data, the last trading day of 2024 saw the NSE 25-Share reach 3402.8 but the graph provided shows that this index concluded 2024 below 3,300.
Further down the rabbit hole, Business Daily has been running the same exact graph indicating it ends in January 2024, before the year changed, as seen in the image below. This misrepresentation could potentially cause significant confusion amongst NSE investors.
Year-to-date (YTD) is an important figure in financial analysis. It is a form of measurement from today’s date back to the start of the calendar year, often meaning January 1st. Unfortunately, for over six months, Business Daily’s chart depicting the NSE’s market capitalization has remained exactly the same.
The graphs should have changed dramatically between the 2024 and 2025 issues, however readers have been misled as the change of the year did not even see a change in the graph.
TKWS has reached out to the Nairobi Securities Exchange (NSE) about the data misrepresentation.


