First Published on February 22nd 2023 by Bob Ciura for SureDividend
Kevin O’Leary is Chairman of O’Shares Investment Advisors, but you probably know him as “Mr. Wonderful”.
He can be seen on CNBC as well as the television show Shark Tank. Investors who have seen him on TV have likely heard him discuss his investment philosophy.
Mr. Wonderful looks for stocks that exhibit three main characteristics:
- •First, they must be quality companies with strong financial performance and solid balance sheets.
- •Second, he believes a portfolio should be diversified across different market sectors.
- •Third, and perhaps most important, he demands income—he insists the stocks he invests in pay dividends to shareholders.
You can download the complete list of all of O’Shares Investment Advisors stock holdings by clicking the link below:

Click here to instantly download your free spreadsheet of all O’Shares Advisors Stocks now, along with important investing metrics.
OUSA owns stocks that display a mix of all three qualities. They are market leaders with strong profits, diversified business models, and they pay dividends to shareholders. The list of OUSA portfolio holdings is an interesting source of quality dividend growth stocks.
This article analyzes the fund’s largest holdings in detail.
Table of Contents
The top 10 holdings from the O’Shares FTSE U.S. Quality Dividend ETF are listed in order of their weighting in the fund, from lowest to highest.
- •McDonald’s Corporation (MCD)
- •T. Rowe Price Group (TROW)
- •Apple Inc. (AAPL)
- •Pfizer Inc. (PFE)
- •Marsh & McLennan Companies (MMC)
- •Johnson & Johnson (JNJ)
- •Merck & Company (MRK)
- •S&P Global (SPGI)
- •Microsoft Corporation (MSFT)
- •Home Depot (HD)
- •Final Thoughts
- •Additional Resources
No. 10: McDonald’s Corporation (MCD)
Dividend Yield: 2.3%
Percentage of OUSA Portfolio: 3.24%
McDonald’s is the world’s leading global foodservice retailer with nearly 40,000 locations in over 100 countries. Approximately 93% of the stores are independently owned and operated. The company has raised its dividend every year since paying its first dividend in 1976, qualifying it as a Dividend Aristocrat.
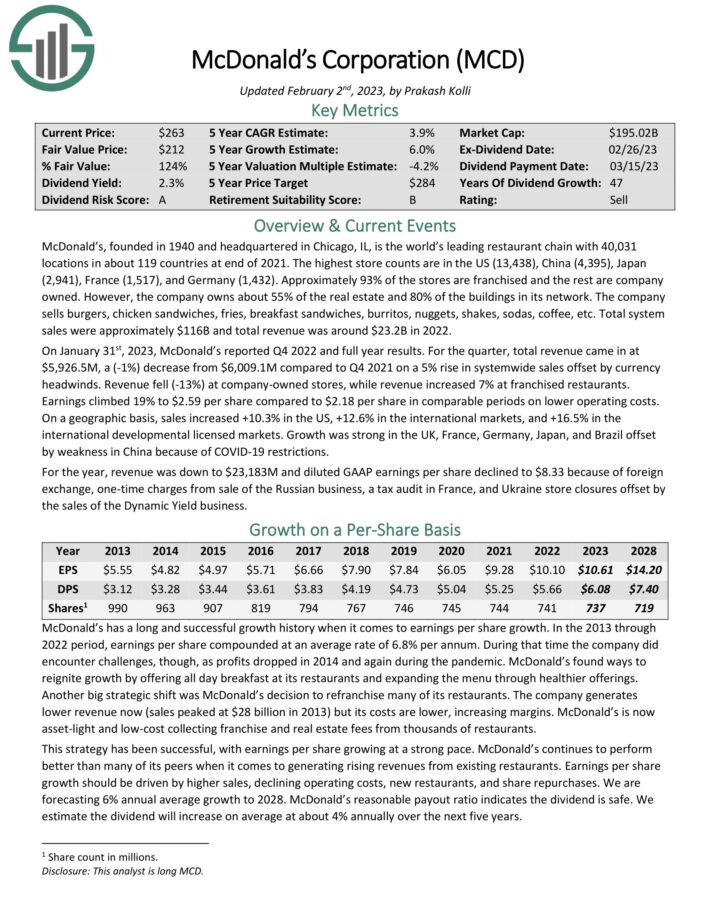
On January 31st, 2023, McDonald’s reported Q4 2022 and full year results. For the quarter, total revenue came in at $5,926.5M, a (-1%) decrease from $6,009.1M compared to Q4 2021 on a 5% rise in system-wide sales offset by currency headwinds. Revenue fell (-13%) at company-owned stores, while revenue increased 7% at franchised restaurants. Earnings climbed 19% to $2.59 per share compared to $2.18 per share in comparable periods on lower operating costs.
On a geographic basis, sales increased +10.3% in the US, +12.6% in the international markets, and +16.5% in the international developmental licensed markets. Growth was strong in the UK, France, Germany, Japan, and Brazil offset by weakness in China because of COVID-19 restrictions. For the year, revenue was down to $23.18 billion and diluted GAAP earnings per share declined to $8.33.
McDonald’s is a very recession-resistant company. Its competitive advantage lies in its global scale, immense network of restaurants, well-known brand, and real estate assets. Indeed, the company’s superior track record against numerous competitors has illustrated why these aspects are important to the company’s success.
Click here to download our most recent Sure Analysis report on MCD (preview of page 1 of 3 shown below):
No. 9: T. Rowe Price Group (TROW)
Dividend Yield: 4.3%
Percentage of OUSA Portfolio: 3.53%
T. Rowe Price Group, founded in 1937 and headquartered in Baltimore, MD, is one of the largest publicly traded asset managers. The company provides a broad array of mutual funds, sub-advisory services, and separate account management for individual and institutional investors, retirement plans and financial intermediaries.
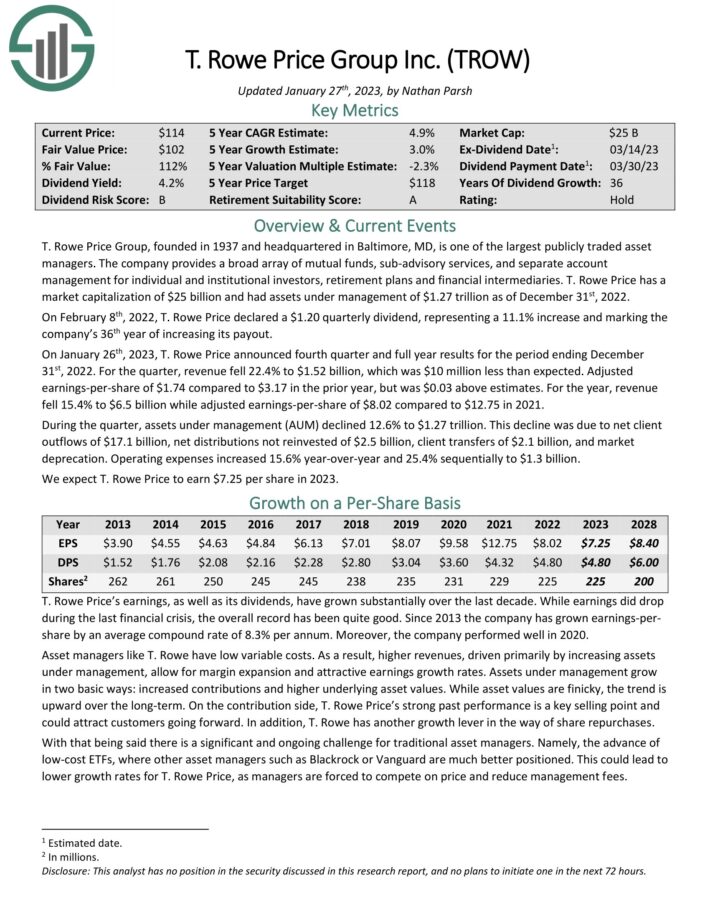
On January 26th, 2023, T. Rowe Price announced fourth quarter and full year results for the period ending December 31st, 2022. For the quarter, revenue fell 22.4% to $1.52 billion, which was $10 million less than expected. Adjusted earnings-per-share of $1.74 compared to $3.17 in the prior year, but was $0.03 above estimates. For the year, revenue fell 15.4% to $6.5 billion while adjusted earnings-per-share of $8.02 compared to $12.75 in 2021.
During the quarter, assets under management (AUM) declined 12.6% to $1.27 trillion. This decline was due to net client outflows of $17.1 billion, net distributions not reinvested of $2.5 billion, client transfers of $2.1 billion, and market deprecation. Operating expenses increased 15.6% year-over-year and 25.4% sequentially to $1.3 billion.
Click here to download our most recent Sure Analysis report on TROW (preview of page 1 of 3 shown below):
No. 8: Apple (AAPL)
Dividend Yield: 0.6%
Percentage of OUSA Portfolio: 3.55%
Apple revolutionized personal technology with the introduction of the Macintosh in 1984. Today the technology company designs, manufactures and sells products such as iPhones, iPads, Mac, Apple Watch and Apple TV.Apple also has a services business that sells music, apps, and subscriptions.
Apple is the #1 holding of Berkshire Hathaway (BRK.B), making the technology giant one of the top Warren Buffett stocks.
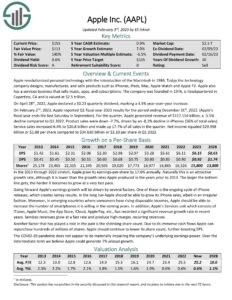
On February 2nd, 2023, Apple reported Q1 fiscal year 2023 results for the period ending December 31st, 2022 (Apple’s fiscal year ends the last Saturday in September). For the quarter, Apple generated revenue of $117.154 billion, a -5.5% decline compared to Q1 2022.
Product sales were down -7.7%, driven by an -8.2% decline in iPhones (56% of total sales). Service sales increased 6.4% to $20.8 billion and made up 17.7% of all sales in the quarter. Net income equaled $29.998 billion or $1.88 per share compared to $34.630 billion or $2.10 per share in Q1 2022.
Click here to download our most recent Sure Analysis report on AAPL (preview of page 1 of 3 shown below):
No. 7: Pfizer Inc. (PFE)
Dividend Yield: 3.8%
Percentage of OUSA Portfolio: 3.59%
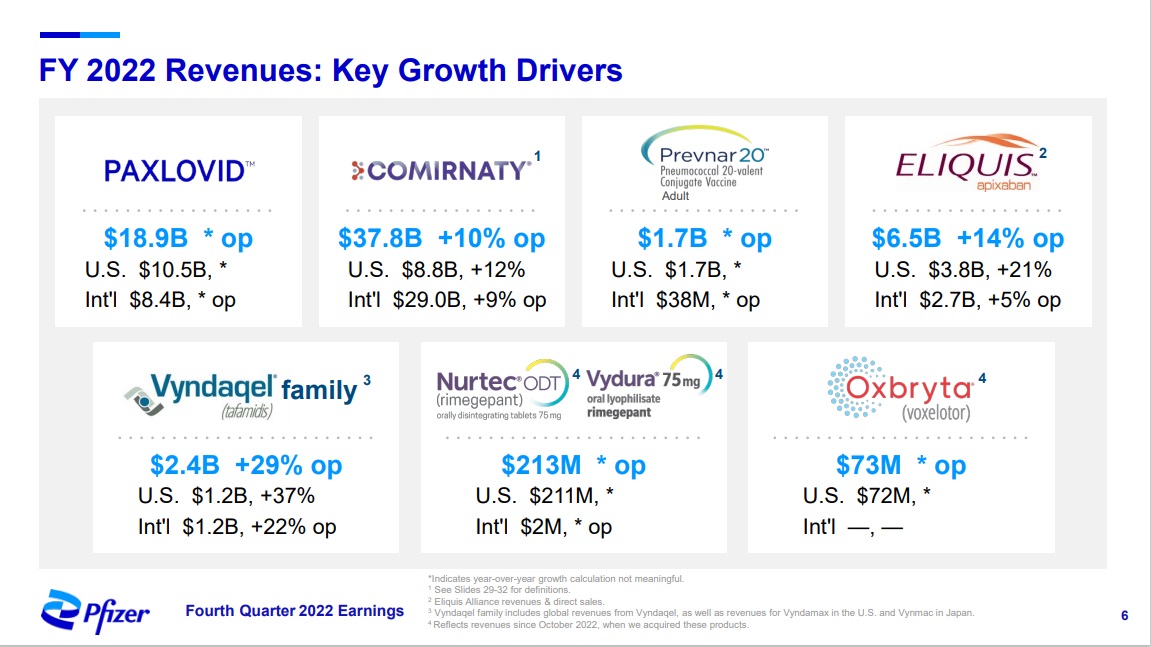
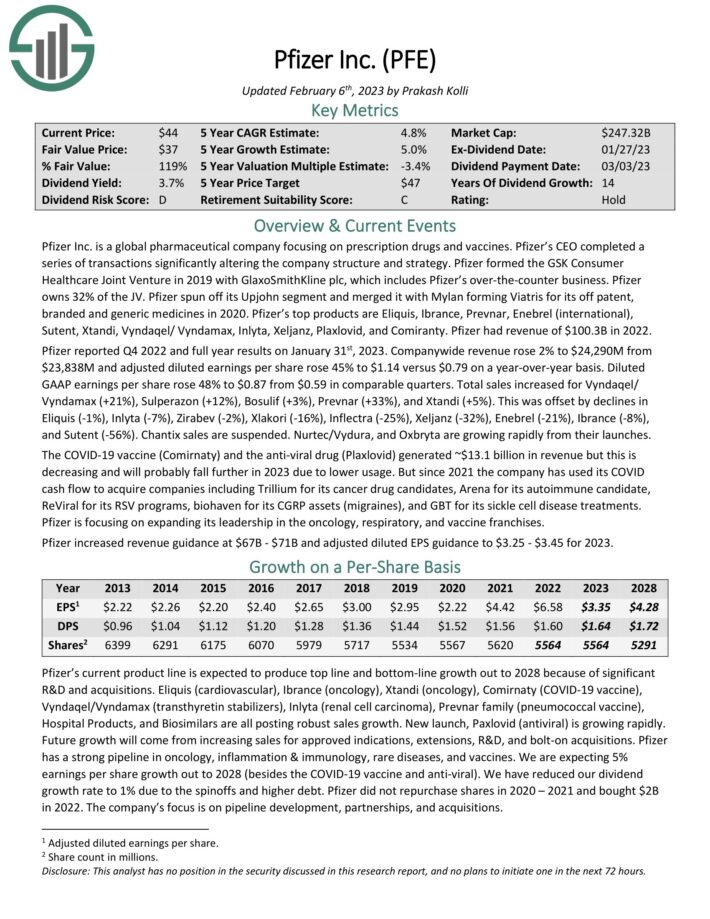
Pfizer Inc. is a global pharmaceutical company that focuses on prescription drugs and vaccines. Pfizer’s top products are Eliquis, Ibrance, Prevnar, Enebrel (international), Sutent, Xtandi, Vyndaqel/ Vyndamax, Inlyta, Xeljanz, Plaxlovid, and Comiranty.
Pfizer reported solid 2022 results:
Source: Investor Presentation
For the fourth quarter, Pfizer reported Q4 2022 and full year results on January 31st, 2023. Companywide revenue rose 2% to $24,290M from $23,838M and adjusted diluted earnings per share rose 45% to $1.14 versus $0.79 on a year-over-year basis. Diluted GAAP earnings per share rose 48% to $0.87 from $0.59 in comparable quarters.
Click here to download our most recent Sure Analysis report on Pfizer (preview of page 1 of 3 shown below):
No. 6: Marsh & McLennan Companies (MMC)
Dividend Yield: 1.4%
Percentage of OUSA Portfolio: 3.76%
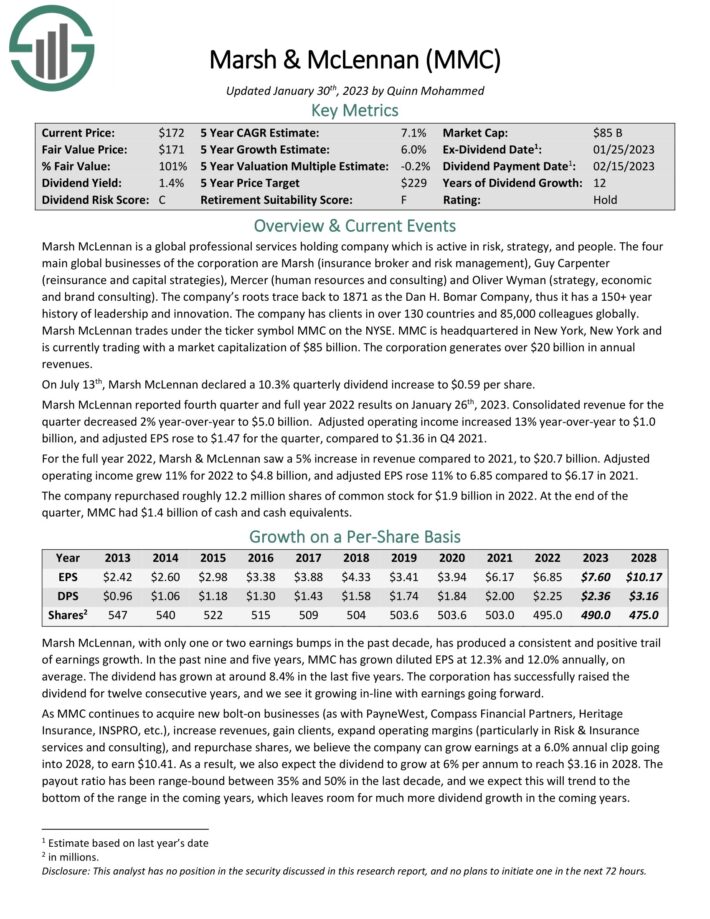
Marsh McLennan is a global professional services holding company which is active in risk, strategy, and people. The four main global businesses of the corporation are Marsh (insurance broker and risk management), Guy Carpenter (reinsurance and capital strategies), Mercer (human resources and consulting) and Oliver Wyman (strategy, economic and brand consulting).
The company has clients in over 130 countries and 86,000 colleagues globally. The corporation generates nearly $20 billion in annual revenues.
Marsh McLennan reported fourth quarter and full year 2022 results on January 26th, 2023. Consolidated revenue for the quarter decreased 2% year-over-year to $5.0 billion. Adjusted operating income increased 13% year-over-year to $1.0 billion, and adjusted EPS rose to $1.47 for the quarter, compared to $1.36 in Q4 2021.
For the full year 2022, Marsh & McLennan saw a 5% increase in revenue compared to 2021, to $20.7 billion. Adjusted operating income grew 11% for 2022 to $4.8 billion, and adjusted EPS rose 11% to 6.85 compared to $6.17 in 2021. The company repurchased roughly 12.2 million shares of common stock for $1.9 billion in 2022. At the end of the quarter, MMC had $1.4 billion of cash and cash equivalents.
Click here to download our most recent Sure Analysis report on MMC (preview of page 1 of 3 shown below):
No. 5: Johnson & Johnson (JNJ)
Dividend Yield: 2.9%
Percentage of OUSA Portfolio: 3.94%
Johnson & Johnson is a global healthcare giant. The company currently operates three segments: Consumer, Pharmaceutical, and Medical Devices & Diagnostics. The corporation includes some 250 subsidiary companies with operations in 60 countries and products sold in over 175 countries.
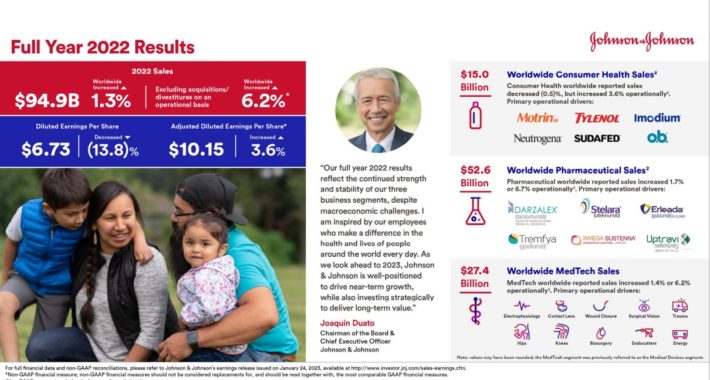
The company’s most recent earnings report was delivered on January 24th, 2023 for the fourth quarter and full year. For the fourth quarter, adjusted EPS of $2.35 beat by $0.11, while revenue of $23.7 billion missed slightly.
Full-year results can be seen in the image below:
Source: Investor Presentation
For 2023, the company expects 4% adjusted operational sales growth (excluding the COVID-19 vaccine) and 3.5% adjusted earnings-per-share growth.
Johnson & Johnson’s key competitive advantage is the size and scale of its business. The company is a worldwide leader in several healthcare categories. Johnson & Johnson’s diversification allows it to continue to grow even if one of the segments is underperforming.
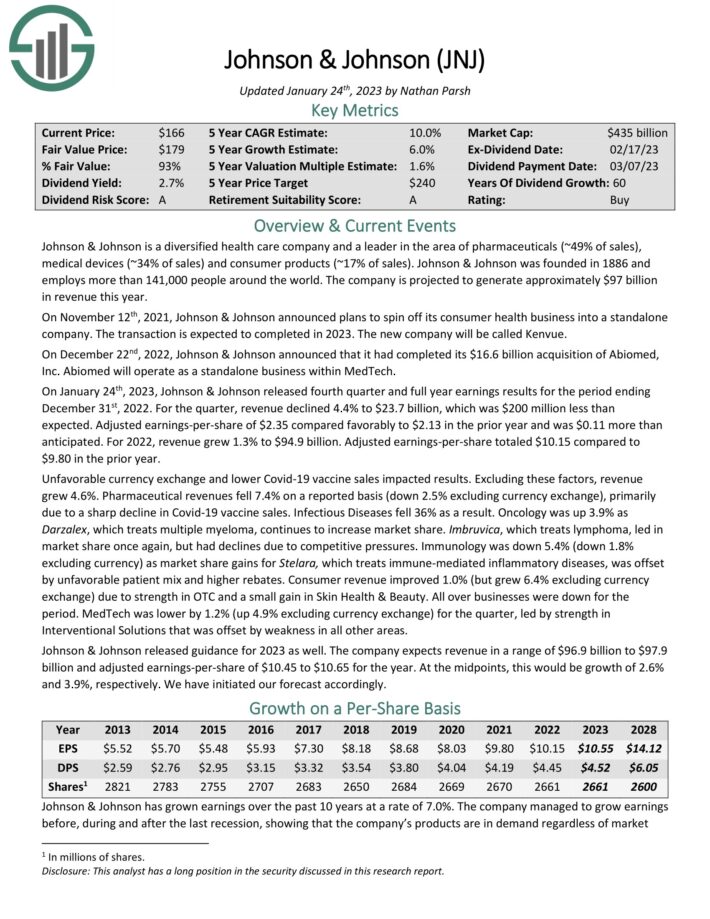
The company has increased its dividend for 60 consecutive years, making it a Dividend King. The stock is owned by many well-known money managers. For example, J&J is a Kevin O’Leary dividend stock.
Click here to download our most recent Sure Analysis report on JNJ (preview of page 1 of 3 shown below):
No. 4: Merck & Company (MRK)
Dividend Yield: 2.6%
Percentage of OUSA Portfolio: 3.96%
Merck & Company is one of the largest healthcare companies in the world. Merck manufactures prescription medicines, vaccines, biologic therapies, and animal health products. Merck employs 67,000 people around the world and generates annual revenues of ~$59 billion.
On February 2nd, 2023, Merck reported fourth quarter and full year results for the period ending December 31st, 2022. For the quarter, revenue grew 2.1% to $13.8 billion, beating estimates by $140 million. Adjusted net income of $4.1 billion, or $1.62 per share, compared to adjusted net income of $4.6 billion, or $1.81 per share, in the prior year, but was $0.08 more than expected. For the year, revenue grew 22% to $59.3 billion. Adjusted earnings-per-share totaled $7.48, above the high end of the company’s guidance.
On a reported basis, pharmaceutical revenue increased 1% to just over $12 billion for the quarter. Keytruda, which treats cancers such as melanoma that cannot be removed by surgery and non-small cell lung cancer, remains the key driver of growth for the company, with sales up 26% to $5.5 billion. The product generated nearly $21 billion in 2022, up from $17 billion in the prior year.
Merck provided guidance for 2023 as well. The company expects sales in a range of $57.2 billion to $58.7 billion with adjusted earnings-per-share projected to be between $6.80 to $6.95. At the midpoint, this would be a decline of 8% from 2022.
Click here to download our most recent Sure Analysis report on Merck (preview of page 1 of 3 shown below):

No. 3: S&P Global (SPGI)
Dividend Yield: 1.0%
Percentage of Portfolio: 4.06%
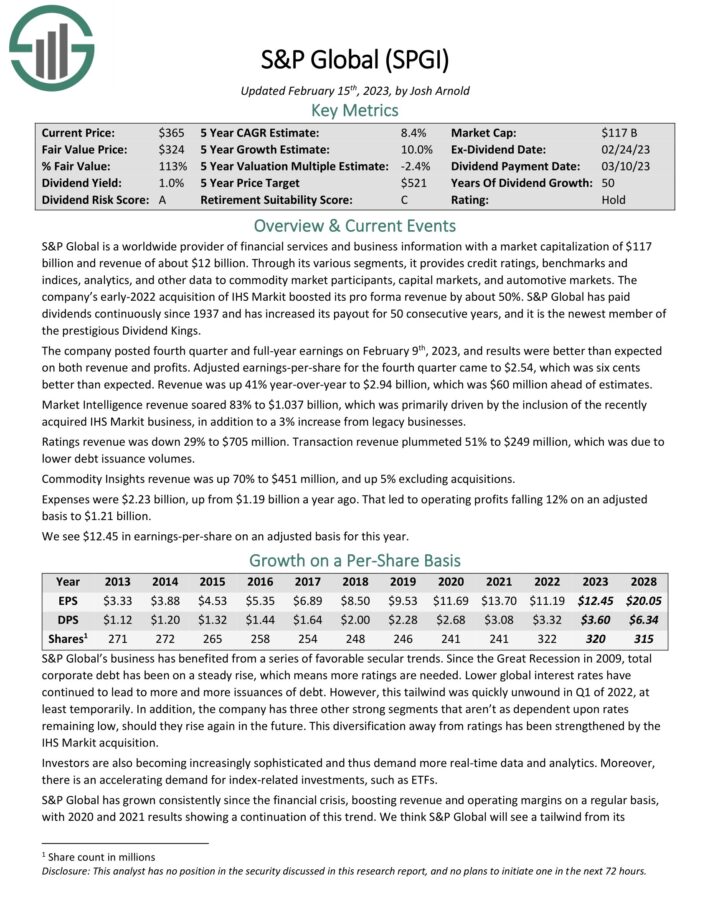
S&P Global is a worldwide provider of financial services and business information with a market capitalization of $113 billion and revenue of about $12 billion. Through its various segments, it provides credit ratings, benchmarks and indices, analytics, and other data to commodity market participants, capital markets, and automotive markets.
S&P Global has paid dividends continuously since 1937 and has increased its payout for 50 consecutive years.
The company posted fourth quarter and full-year earnings on February 9th, 2023, and results were better than expected on both revenue and profits. Adjusted earnings-per-share for the fourth quarter came to $2.54, which was six cents better than expected.
Revenue was up 41% year-over-year to $2.94 billion, which was $60 million ahead of estimates. Market Intelligence revenue soared 83% to $1.037 billion, which was primarily driven by the inclusion of the recently acquired IHS Markit business, in addition to a 3% increase from legacy businesses.
Click here to download our most recent Sure Analysis report on SPGI (preview of page 1 of 3 shown below):
No. 2: Microsoft Corporation (MSFT)
Dividend Yield: 1.1%
Percentage of OUSA Portfolio: 4.82%
Microsoft Corporation, founded in 1975 and headquartered in Redmond, WA, develops, manufactures and sells both software and hardware to businesses and consumers.
Its offerings include operating systems, business software, software development tools, video games and gaming hardware, and cloud services.
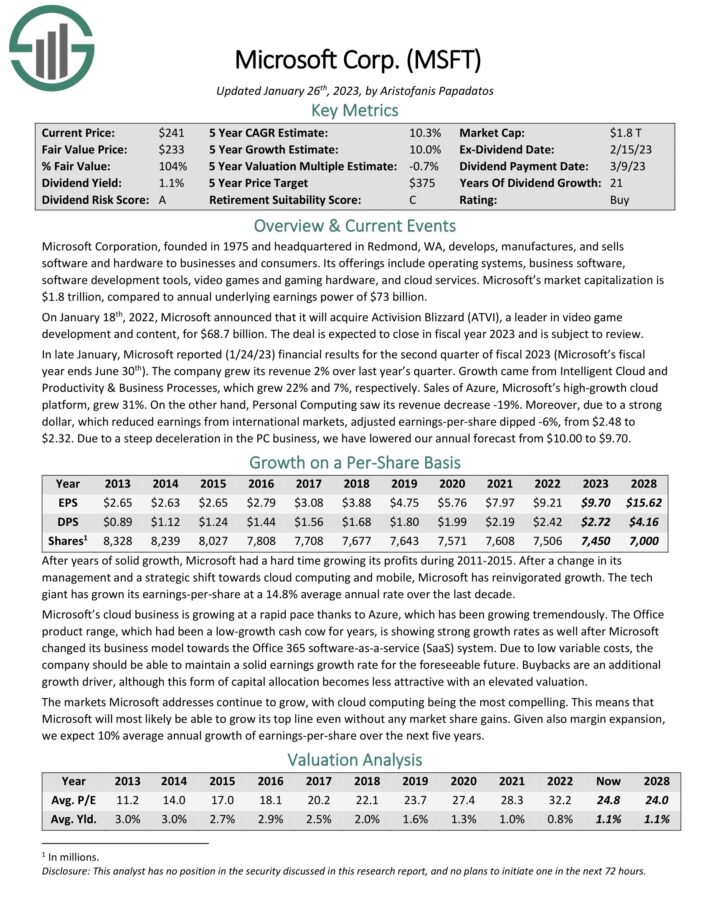
In late January, Microsoft reported (1/24/23) financial results for the second quarter of fiscal 2023 (Microsoft’s fiscal year ends June 30th). The company grew its revenue 2% over last year’s quarter. Growth came from Intelligent Cloud and Productivity & Business Processes, which grew 22% and 7%, respectively. Sales of Azure, Microsoft’s high-growth cloud platform, grew 31%. On the other hand, Personal Computing saw its revenue decrease -19%.
Moreover, due to a strong dollar, which reduced earnings from international markets, adjusted earnings-per-share dipped -6%, from $2.48 to $2.32.
Click here to download our most recent Sure Analysis report on Microsoft (preview of page 1 of 3 shown below):
No. 1: Home Depot (HD)
Dividend Yield: 2.8%
Percentage of OUSA Portfolio: 4.86%
Home Depot was founded in 1978, and since that time has grown into the leading home improvement retailer with almost 2,300 stores in the U.S., Canada, and Mexico. In all, Home Depot generates annual revenue of approximately $130 billion.
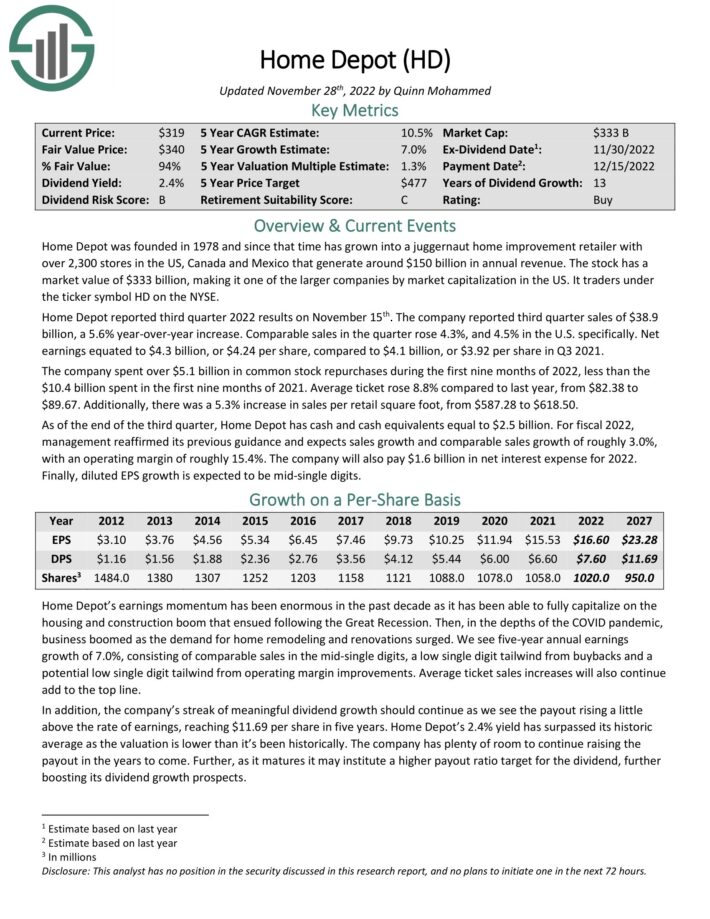
Home Depot reported third quarter 2022 results on November 15th. The company reported third quarter sales of $38.9 billion, a 5.6% year-over-year increase. Comparable sales in the quarter rose 4.3%, and 4.5% in the U.S. specifically. Net earnings equated to $4.3 billion, or $4.24 per share, compared to $4.1 billion, or $3.92 per share in Q3 2021.
The company spent over $5.1 billion in common stock repurchases during the first nine months of 2022, less than the $10.4 billion spent in the first nine months of 2021. Average ticket rose 8.8% compared to last year, from $82.38 to $89.67. Additionally, there was a 5.3% increase in sales per retail square foot, from $587.28 to $618.50.
Click here to download our most recent Sure Analysis report on HD (preview of page 1 of 3 shown below):
Final Thoughts
Kevin O’Leary has become a household name due to his appearances on the TV show Shark Tank. But he is also a well-known asset manager, and his investment philosophy largely aligns with Sure Dividend’s. Specifically, Kevin O’Leary typically invests in stocks with large and profitable businesses, with strong balance sheets and consistent dividend growth every year.
Not all of these stocks are currently rated as buys in the Sure Analysis Research Database, which ranks stocks based on expected total return due to a combination of earnings per share growth, dividends, and changes in the price-to-earnings multiple.
However, several of these 10 stocks are valuable holdings for a long-term dividend growth portfolio.
This article was first published by Bob Ciura for Sure Dividend
Sure dividend helps individual investors build high-quality dividend growth portfolios for the long run. The goal is financial freedom through an investment portfolio that pays rising dividend income over time. To this end, Sure Dividend provides a great deal of free information.
Related:
Top 20 Highest-Yielding Dividend Aristocrats Now | Yields Up To 5.4%


