
Stock analysis updated on May 3rd, 2023 by Bob Ciura. Article updated on April 11th, 2023 by Ben Reynolds for SureDividend
Spreadsheet data updated daily
High dividend stocks are stocks with a dividend yield well in excess of the market average dividend yield of 1.7%.
The resources in this report focus on truly high yielding securities, often with dividend yields multiples higher than the market average.
Resource #1: The High Dividend Stocks List Spreadsheet

Note: The spreadsheet uses the Wilshire 5000 as the universe of securities from which to select, plus a few additional securities we screen for 5%+ dividend yields.
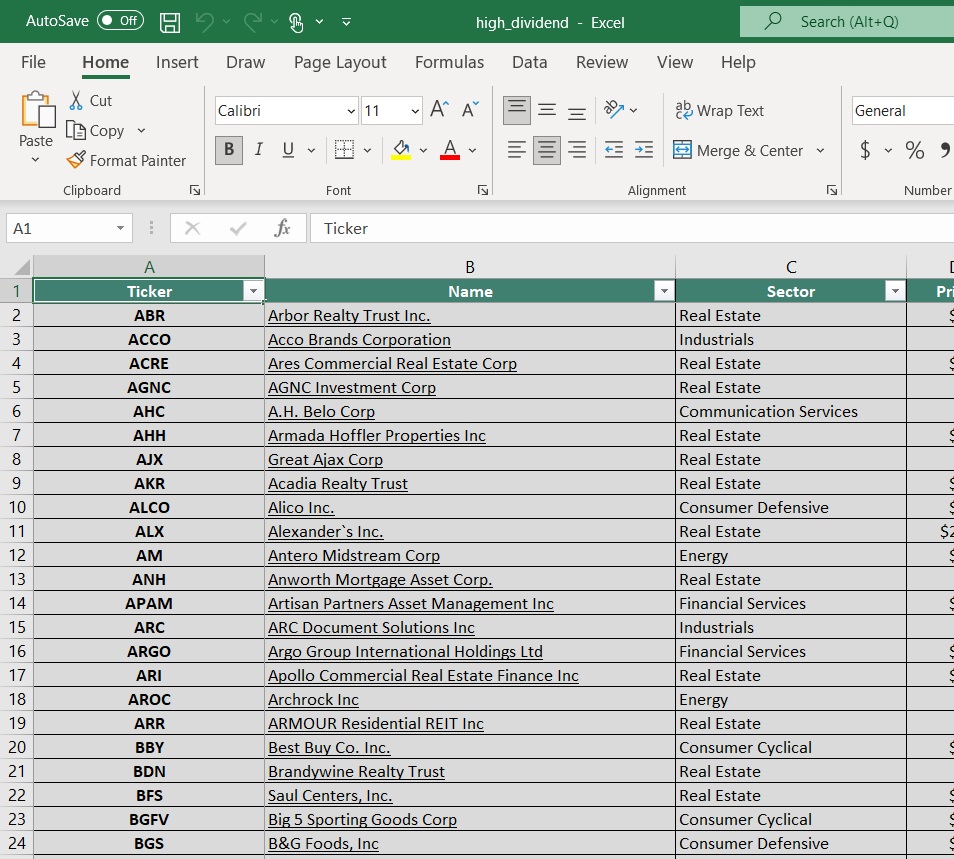
The free high dividend stocks list spreadsheet has our full list of 252 individual securities (stocks, REITs, MLPs, etc.) with 5%+ dividend yields.
The high dividend stocks spreadsheet has important metrics to help you find compelling ultra high yield income investing ideas. These metrics include:
- •Market cap
- •Payout ratio
- •Dividend yield
- •Trailing P/E ratio
- •Annualized 5-year dividend growth rate
Resource #2: The 7 Best High Yield Stocks Now
This resource analyzes the 7 best high-yield stocks in detail. The criteria we use to rank high dividend securities in this resource are:
- •Is in the 850+ income security Sure Analysis Research Database
- •Rank based on dividend yield, from highest to lowest
- •Dividend Risk Scores of C or better
- •Based in the U.S.
Additionally, a maximum of three stocks are allowed for any single sector to ensure diversification.
Resource #3: The High Dividend 50 Series
The High Dividend 50 Series is where we analyze the 50 highest-yielding securities in the Sure Analysis Research Database. The series consists of 50 stand-alone analysis reports on these securities.
Resource #4: More High-Yield Investing Research
– How to calculate your income per month based on dividend yield
– The risks of high-yield investing
– Other high dividend research
The 7 Best High Yield Stocks Now
This resource analyzes the 7 best high yielding securities in the Sure Analysis Research Database as ranked by the following criteria:
- •Rank based on dividend yield, from highest to lowest
- •Dividend Risk Scores of C or better
- •Based in the U.S.
Additionally, a maximum of three stocks were allowed for any single market sector to ensure diversification.
It’s difficult to define ‘best’. Here, we are using ‘best’ in terms of highest yields with reasonable and better dividend safety.
A tremendous amount of research goes into finding these 7 high yield securities. We analyze more than 850 income securities every quarter in the Sure Analysis Research Database. This is real analysis done by our analyst team, not a quick computer screen.
“So I think it was just looking at different companies and I always thought if you looked at 10 companies, you’d find one that’s interesting, if you’d look at 20, you’d find two, or if you look at 100 you’ll find 10. The person that turns over the most rocks wins the game. I’ve also found this to be true in my personal investing.”
– Investing legend Peter Lynch
Click here to download a PDF report for just one of the 850+ income securities we cover in Sure Analysis to get an idea of the level of work that goes into finding compelling income investments for our audience.
The 7 best high yield securities are listed in order by dividend yield below, from lowest to highest.
- •High Dividend Stock #7: Altria Group (MO)
- •High Dividend Stock #6: First of Long Island (FLIC)
- •High Dividend Stock #5: Lincoln National Corp. (LNC)
- •High Dividend Stock #4: Western Union (WU)
- •High Dividend Stock #3: MPLX LP (MPLX)
- •High Dividend Stock #2: City Office REIT (CIO)
- •High Dividend Stock #1: Office Properties Income Trust (OPI)
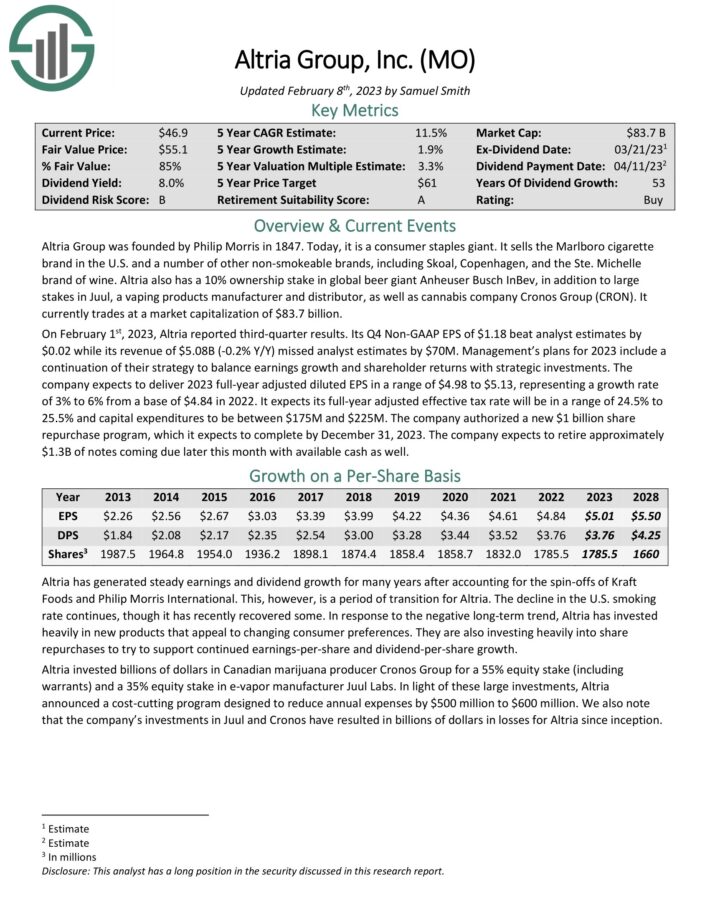
High Dividend Stock #7: Altria Group (MO)
- •Dividend Yield: 8.0%
- •Dividend Risk Score: B
Altria Group was founded by Philip Morris in 1847. Today, it is a consumer staples giant. It sells the Marlboro cigarette brand in the U.S. and a number of other non-smokeable brands, including Skoal and Copenhagen.
The flagship brand continues to be Marlboro, which commands over 40% retail market share in the U.S.
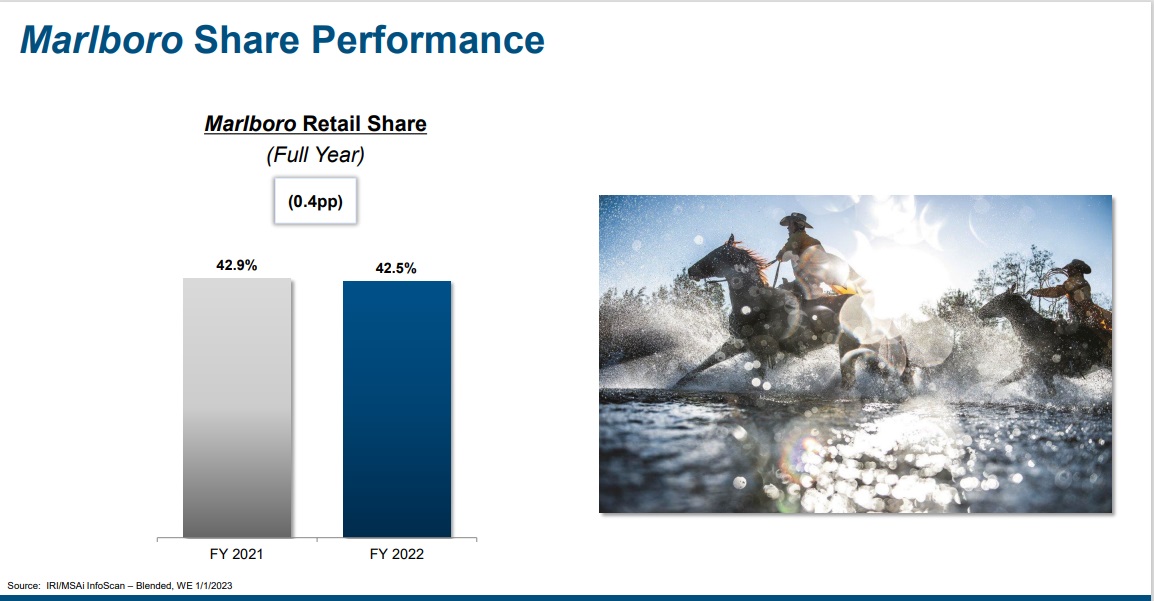
Source: Investor Presentation
On February 1st, 2023, Altria reported third-quarter results. Its Q4 Non-GAAP EPS of $1.18 beat analyst estimates by $0.02 while its revenue of $5.08B (-0.2% Y/Y) missed analyst estimates by $70M. Management’s plans for 2023 include a continuation of their strategy to balance earnings growth and shareholder returns with strategic investments.
The company expects to deliver 2023 full-year adjusted diluted EPS in a range of $4.98 to $5.13, representing a growth rate of 3% to 6% from a base of $4.84 in 2022. It expects its full-year adjusted effective tax rate will be in a range of 24.5% to 25.5% and capital expenditures to be between $175M and $225M. The company authorized a new $1 billion share repurchase program, which it expects to complete by December 31, 2023.
Altria has increased its dividend for over 50 years, placing it on the exclusive Dividend Kings list. It is also a Dividend Champion.
Click here to download our most recent Sure Analysis report on Altria (preview of page 1 of 3 shown below):
High Dividend Stock #6: First of Long Island (FLIC)
- •Dividend Yield: 8.5%
- •Dividend Risk Score: A
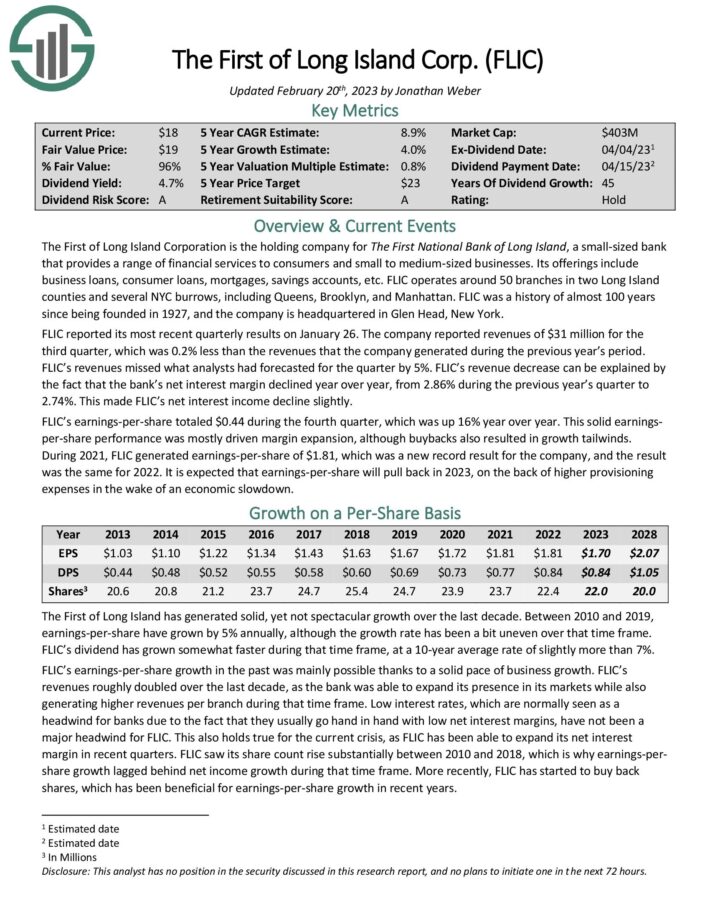
The First of Long Island Corporation is the holding company for The First National Bank of Long Island, a small-sized bank that provides a range of financial services to consumers and small to medium-sized businesses. Its offerings include business loans, consumer loans, mortgages, savings accounts, etc.
FLIC operates around 50 branches in two Long Island counties and several NYC burrows, including Queens, Brooklyn, and Manhattan. FLIC has a history of almost 100 years, as it was founded in 1927, and the company is headquartered in Glen Head, New York.
Thanks to its disciplined and conservative management, FLIC has exhibited an admirable performance record. The company has consistently grown its earnings per share every single year over the last nine years.
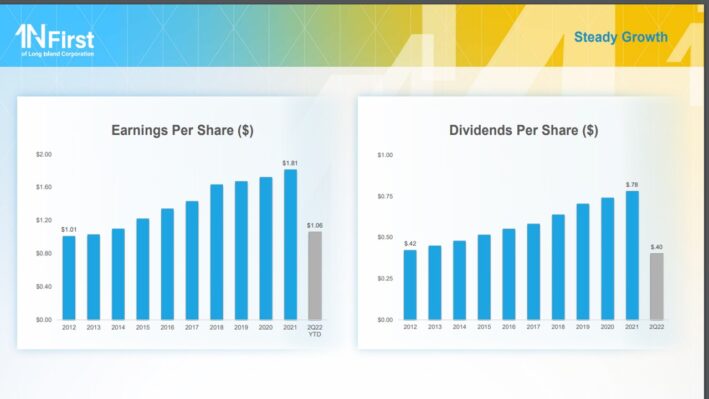
Thanks to its consistent earnings growth record, FLIC has raised its dividend for 45 consecutive years. This is undoubtedly an impressive dividend growth streak.
Moreover, the stock is currently offering a nearly 10-year high dividend yield of 6.6%, with a solid payout ratio of 49%. Given the robust business model of the company, its dividend is safe. FLIC is a high dividend stock to buy.
Click here to download our most recent Sure Analysis report on First of Long Island Corporation (preview of page 1 of 3 shown below):
High Dividend Stock #5: Lincoln National Corp. (LNC)
- •Dividend Yield: 8.8%
- •Dividend Risk Score: C
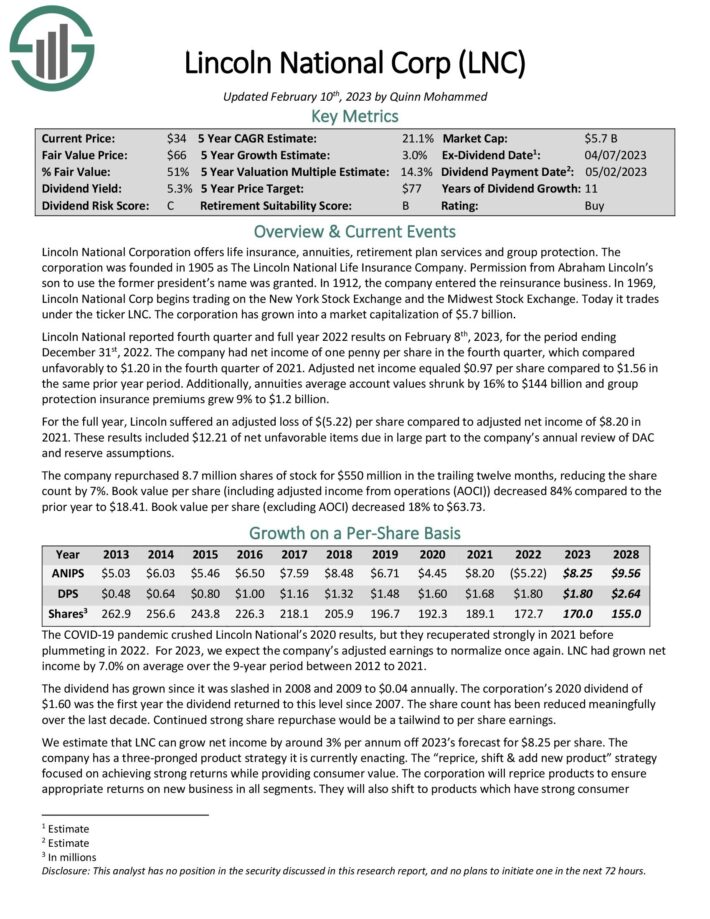
Lincoln National is an insurance company that offers retirement plan services, life insurance, and similar products to its customers. Lincoln National was founded more than 100 years ago, in 1905.
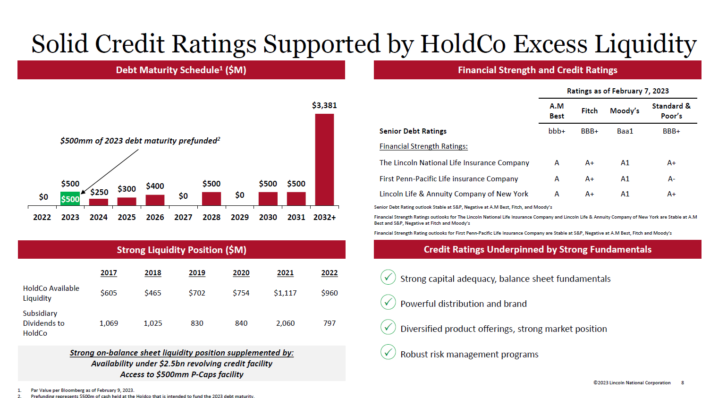
Source: Investor presentation
The company reported net losses in 2022, but that was primarily driven by unrealized and realized losses in its investment portfolio, which, in turn, were caused by the market turmoil we have seen in bond and equity markets.
Underlying business performance has been solid, and it is expected that profitability will be strong this year as well. At the same time, Lincoln National trades at a very inexpensive valuation, in part due to the sell-off among financial stocks in early 2023.
At current prices, Lincoln National trades with a dividend yield of 8.8%. The dividend is well-covered with a payout ratio of just above 20%, based on the consensus earnings-per-share estimate for the current year.
Click here to download our most recent Sure Analysis report on LNC (preview of page 1 of 3 shown below):
High Dividend Stock #4: Western Union (WU)
- •Dividend Yield: 8.9%
- •Dividend Risk Score: C
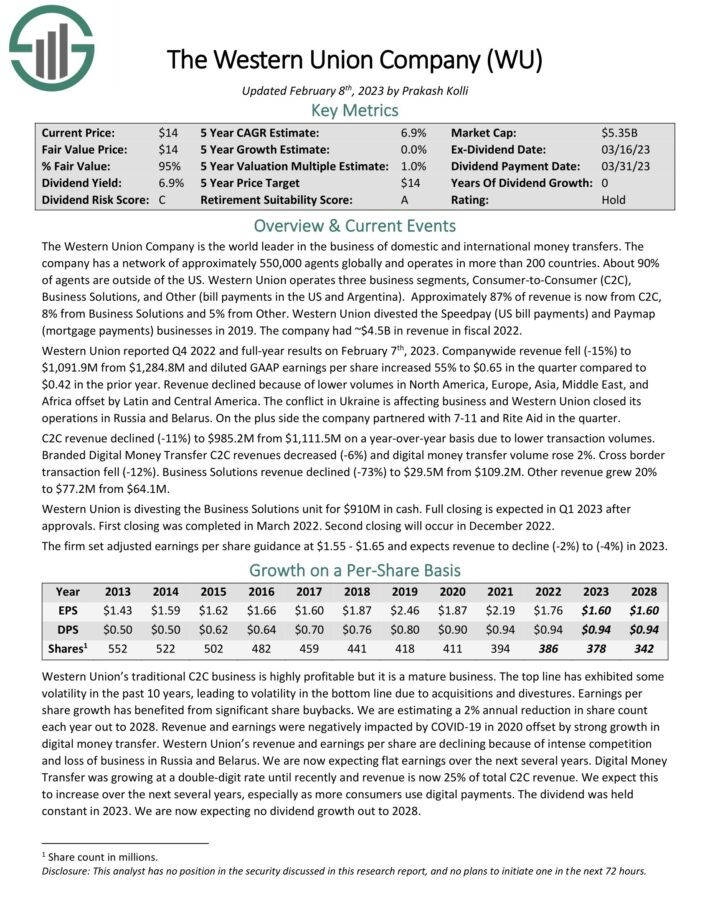
The Western Union Company is the world leader in the business of domestic and international money transfers. The company has a network of approximately 550,000 agents globally and operates in more than 200 countries. About 90% of agents are outside of the US. Western Union operates three business segments, Consumer-to-Consumer (C2C), Business Solutions, and Other (bill payments in the US and Argentina).
Approximately 87% of revenue is now from C2C, 8% from Business Solutions and 5% from Other. The company had ~$4.5B in revenue in fiscal 2022.
Western Union reported Q4 2022 and full-year results on February 7th, 2023. Companywide revenue fell (-15%) to $1,091.9M from $1,284.8M and diluted GAAP earnings per share increased 55% to $0.65 in the quarter compared to $0.42 in the prior year. Revenue declined because of lower volumes in North America, Europe, Asia, Middle East, and Africa offset by Latin and Central America.
WU pointed to resilience in remittances in the most recent quarter.
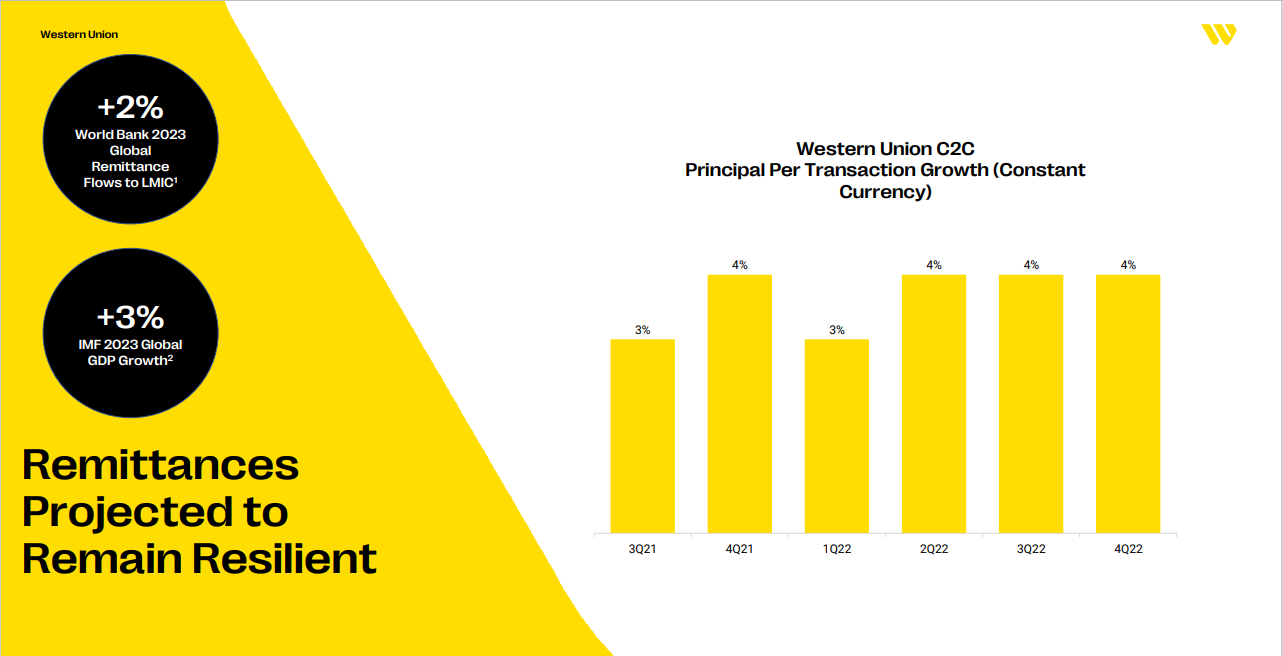
Source: Investor Presentation
C2C revenue declined (-11%) to $985.2M from $1,111.5M on a year-over-year basis due to lower transaction volumes. Branded Digital Money Transfer C2C revenues decreased (-6%) and digital money transfer volume rose 2%. Cross border transaction fell (-12%). Business Solutions revenue declined (-73%) to $29.5M from $109.2M. Other revenue grew 20% to $77.2M from $64.1M.
Western Union is divesting the Business Solutions unit for $910M in cash. Full closing is expected in Q1 2023 after approvals. First closing was completed in March 2022. Second closing will occur in December 2022. The firm set adjusted earnings per share guidance at $1.55 – $1.65 and expects revenue to decline (-2%) to (-4%) in 2023.
Click here to download our most recent Sure Analysis report on Western Union (preview of page 1 of 3 shown below):
High Dividend Stock #3: MPLX LP (MPLX)
- •Dividend Yield: 8.9%
- •Dividend Risk Score: C
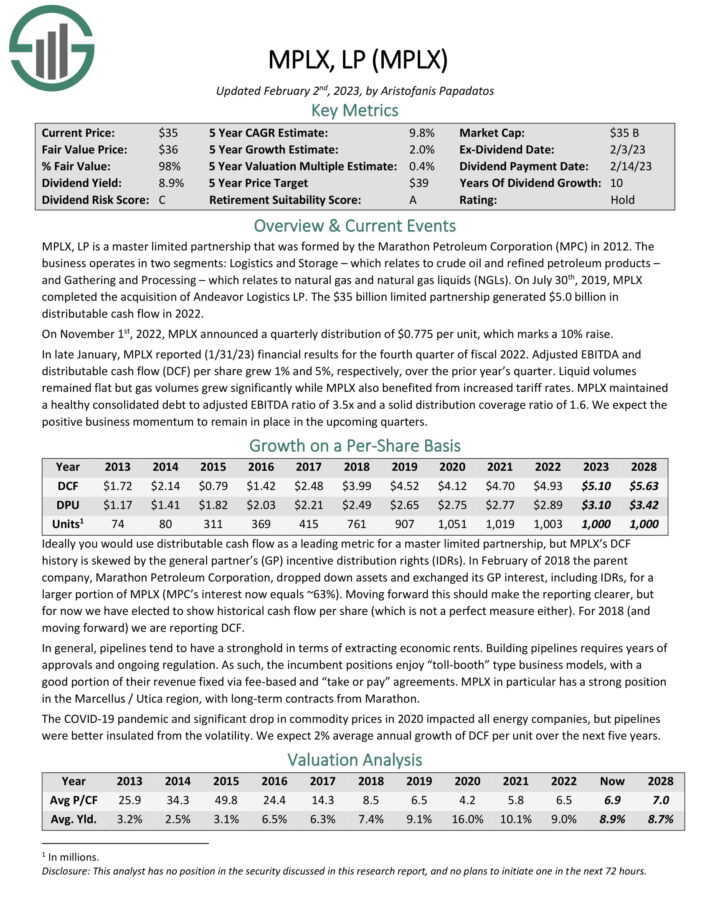
MPLX LP is a Master Limited Partnership that was formed by the Marathon Petroleum Corporation (MPC) in 2012.
The business operates in two segments: Logistics and Storage – which relates to crude oil and refined petroleum products – and Gathering and Processing – which relates to natural gas and natural gas liquids (NGLs). In 2019, MPLX acquired Andeavor Logistics LP.
You can see highlights from the company’s performance in 2022 in the image below:
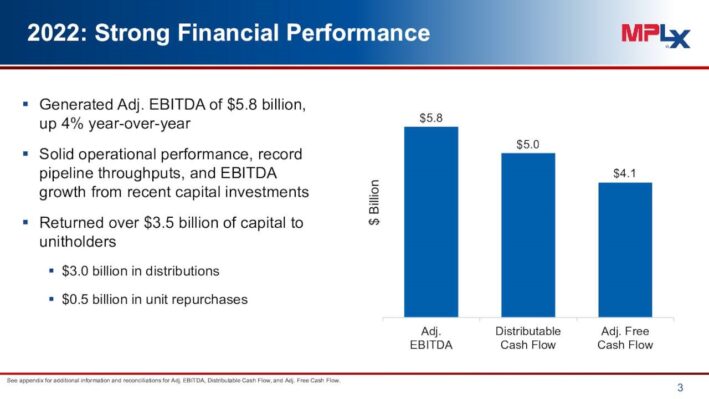
In late January, MPLX reported (1/31/23) financial results for the fourth quarter of fiscal 2022. Adjusted EBITDA and distributable cash flow (DCF) per share grew 1% and 5%, respectively, over the prior year’s quarter. Liquid volumes remained flat but gas volumes grew significantly while MPLX also benefited from increased tariff rates.
MPLX maintained a healthy consolidated debt to adjusted EBITDA ratio of 3.5x and a solid distribution coverage ratio of 1.6. We expect the positive business momentum to remain in place in the upcoming quarters.
Click here to download our most recent Sure Analysis report on MPLX (preview of page 1 of 3 shown below):
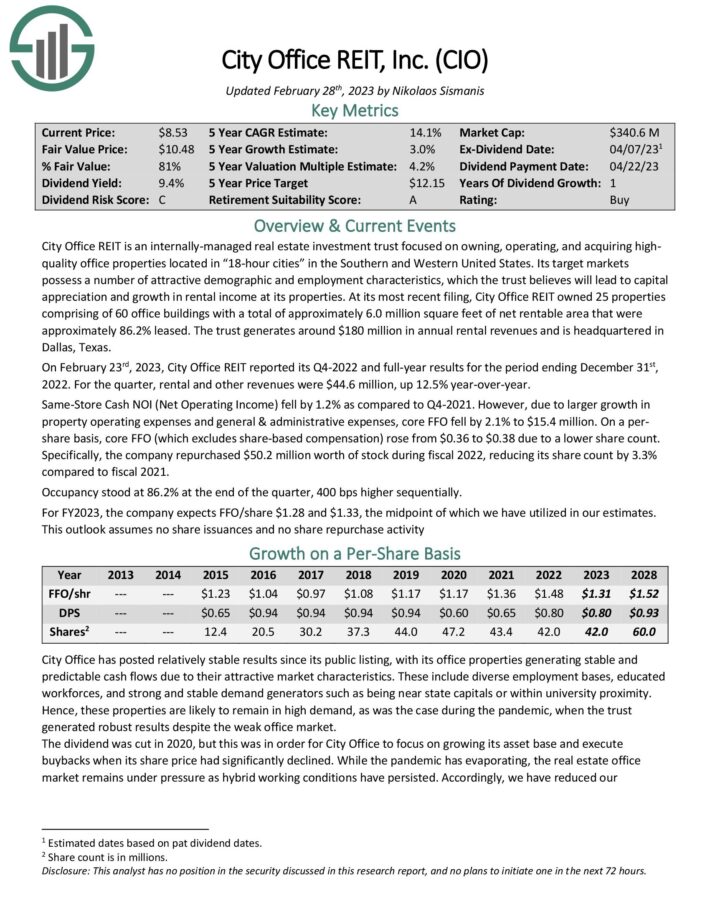
High Dividend Stock #2: City Office REIT (CIO)
- •Dividend Yield: 14.5%
- •Dividend Risk Score: C
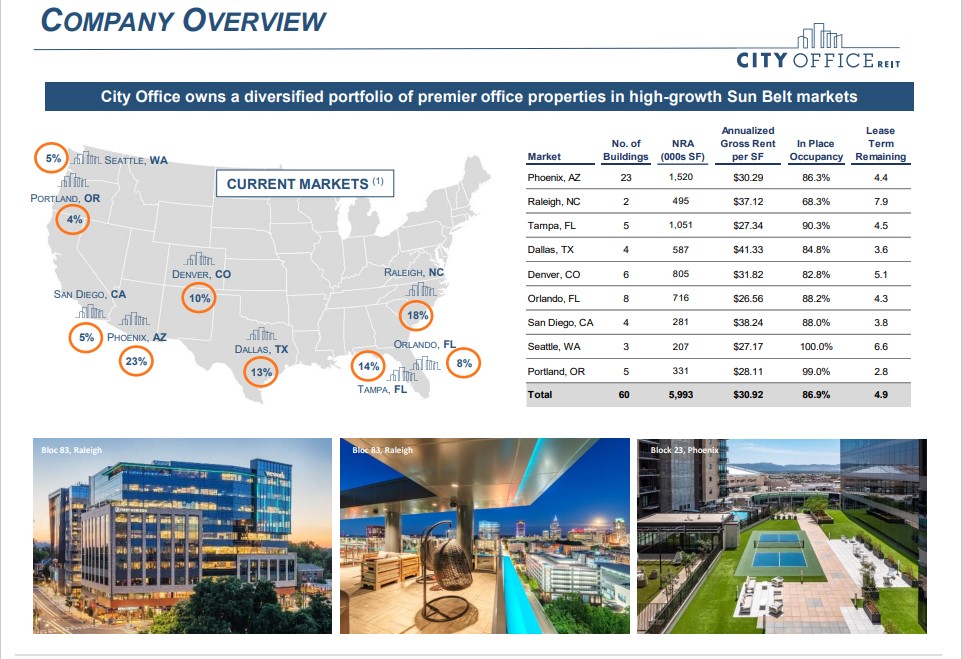
City Office REIT is an internally-managed real estate investment trust focused on owning, operating, and acquiring high-quality office properties located in “18-hour cities” in the Southern and Western United States.
Its target markets possess a number of attractive demographic and employment characteristics, which the trust believes will lead to capital appreciation and growth in rental income at its properties.
Source: Investor Presentation
The company was able to grow its funds from operations-per-share in both 2021 and 2022, which was a strong feat. While rising interest rates are forecasted to be a headwind in the current year, City Office should continue to cover the dividend easily, as we are forecasting a payout ratio of 61% for the company’s current dividend of $0.80 per share per year.
City Office currently trades with a very high dividend yield of 14.5%, which is very strong. Since we are also forecasting some minor funds from operations growth over the coming years, and since we believe that City Office has upside potential towards what we deem fair value, the expected total return is north of 20% per year over the coming five years.
Click here to download our most recent Sure Analysis report on Office Properties (CIO) (preview of page 1 of 3 shown below):
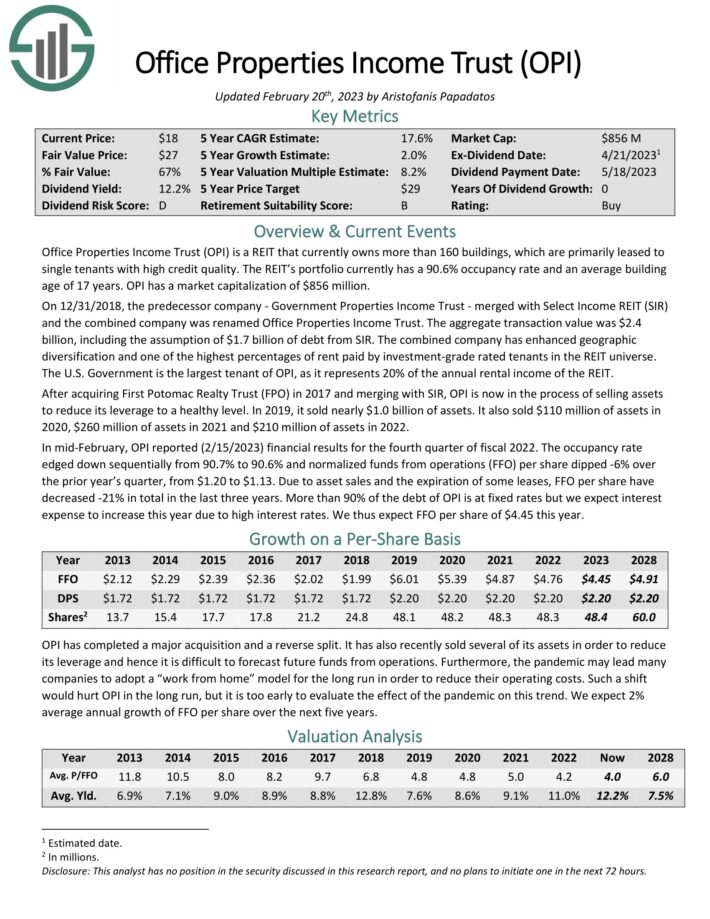
High Dividend Stock #1: Office Properties Income REIT (OPI)
- •Dividend Yield: 16.8%
- •Dividend Risk Score: B
Office Properties Income Trust is a REIT that currently owns more than 160 buildings, which are primarily leased to single tenants with high credit quality. The REIT’s portfolio currently has a 90.6% occupancy rate and an average building age of 17 years.
The U.S. Government is the largest tenant of OPI, as it represents 20% of the annual rental income of the REIT.

Source: Investor Presentation
In mid-February, OPI reported (2/15/2023) financial results for the fourth quarter of fiscal 2022. The occupancy rate edged down sequentially from 90.7% to 90.6% and normalized funds from operations (FFO) per share dipped -6% over the prior year’s quarter, from $1.20 to $1.13.
Due to asset sales and the expiration of some leases, FFO per share have decreased -21% in total in the last three years. More than 90% of the debt of OPI is at fixed rates but we expect interest expense to increase this year due to high interest rates.
Click here to download our most recent Sure Analysis report on OPI (preview of page 1 of 3 shown below):
The High Dividend 50 Series
The High Dividend 50 Series is analysis on the 50 highest-yielding Sure Analysis Research Database stocks, excluding royalty trusts, BDCs, REITs, and MLPs.
Click on a company’s name to view the high dividend 50 series article for that company. A link to the specific Sure Analysis Research Database report page for each security is included as well.
More High-Yield Investing Resources
How To Calculate Your Monthly Income Based On Dividend Yield
A common question for income investors is “how much money can I expect to receive per month from my investment?”
To find your monthly income, follow these steps:
- •Find your investment’s dividend yield
Note: Dividend yield can be calculated as dividends per share divided by share price - •Multiply it by the current value of your holding
Note: If you haven’t yet invested, multiply dividend yield by the amount you plan to invest - •Divide this number by 12 to find monthly income
To find the monthly income from your entire portfolio, repeat the above calculation for each of your holdings and add them together.
You can also use this formula backwards to find the dividend yield you need from your investments to make a certain amount of monthly dividend income.
The example below assumes you want to know what dividend yield you need on a $240,000 investment to generate $1,000/month in dividend income.
- •Multiply $1,000 by 12 to find annual income target of $12,000
- •Divide $12,000 by your investment amount of $240,000 to find your target yield of 5.0%
In practice most dividend stocks pay dividends quarterly, so you would actually receive 3x the monthly amount quarterly instead of receiving a payment every month. However, some stocks do actually pay monthly dividends. You can see our monthly dividend stocks list here.
The Risks Of High-Yield Investing
Investing in high-yield stocks is a great way to generate income. But it is not without risks.
First, stock prices fluctuate. Investors need to understand their risk tolerance before investing in high dividend stocks. Share price fluctuations means that your investment can (and almost certainly will) decline in value, at least temporarily (and possibly permanently) do to market volatility.
Second, businesses grow and decline. Investing in a stock gives you fractional ownership in the underlying business. Some businesses grow over time. These businesses are likely to pay higher dividends over time. The Dividend Champions are an excellent example of this; each has paid rising dividends for 25+ consecutive years.
What’s dangerous is when a business declines. Dividends are paid out of a company’s cash flows. If the business sees its cash flows decline, or worse is losing money, it may reduce or eliminate its dividend. Business decline is a real risk with high yield investing. Business declines often coincide with and or accelerate during recessions.
A company’s payout ratio gives a good gauge of how much ‘room’ a company has to pay its dividend. The payout ratio is calculated as dividends divided by income. The lower the payout ratio, the better, because dividends have more earnings coverage.
A company with a payout ratio over 100% is paying out more in dividends than it is making in profits, a long-term unsustainable situation. A company with a payout ratio of 50% is making double in income what it is paying out in dividends, so it has ‘room’ for earnings to decline significantly without reducing its dividend.
Third, management teams can change their dividend policies. Even if a company isn’t declining, the company’s management team may change priorities and reduce or eliminate its dividend. In practice, this typically occurs if a company has a high level of debt and wants to focus on debt reduction. But it could in theory happen to any dividend paying stock.
The risks of high yield investing can be reduced (but not eliminated) by investing in higher quality businesses in a diversified portfolio of 20 or more stocks. This reduces both business decline risk (by investing in high quality businesses) and the shock to your portfolio if any one stock does reduce or eliminate its dividend (through diversification).
This article was first published by Bob Ciura for Sure Dividend
Sure dividend helps individual investors build high-quality dividend growth portfolios for the long run. The goal is financial freedom through an investment portfolio that pays rising dividend income over time. To this end, Sure Dividend provides a great deal of free information.
Related:


