

First Published on March 14th, 2023 by Bob Ciura for SureDividend
Business Development Companies, otherwise known as BDCs, are highly popular among income investors. BDCs widely have high dividend yields of 5% or higher.
This makes BDCs very appealing for income investors such as retirees. With this in mind, we’ve created a list of BDCs.
You can download your free copy of our BDC list, along with relevant financial metrics such as P/E ratios and dividend payout ratios, by clicking on the link below:
Of course, before investing in BDCs, investors should understand the unique characteristics of the sector.
This article will provide an overview of BDCs. It will also list our top 5 BDCs right now as ranked by expected total returns in The Sure Analysis Research Database.
Table Of Contents
The table of contents below provides for easy navigation of the article:
- •Overview of BDCs
- •Why Invest In BDCs?
- •Tax Considerations Of BDCs
- •The Top 5 BDCs Today
- •Final Thoughts
Overview of BDCs
Business Development Companies are closed-end investment firms. Their business model involves making debt and/or equity investments in other companies, typically small or mid-size businesses.
These target companies may not have access to traditional means of raising capital, which makes them suitable partners for a BDC. BDCs invest in a variety of companies, including turnarounds, developing, or distressed companies.
BDCs are registered under the Investment Company Act of 1940. As they are publicly-traded, BDCs must also be registered with the Securities and Exchange Commission.
To qualify as a BDC, the firm must invest at least 70% of its assets in private or publicly-held companies with market capitalizations of $250 million or below.
BDCs make money by investing with the goal of generating income, as well as capital gains on their investments if and when they are sold.
In this way, BDCs operate similar business models as a private equity firm or venture capital firm.
The major difference is that private equity and venture capital investment is typically restricted to accredited investors, while anyone can invest in publicly-traded BDCs.
Why Invest In BDCs?
The obvious appeal for BDCs is their high dividend yields. It is not uncommon to find BDCs with dividend yields above 5%. In some cases, certain BDCs provide 10%+ yields.
Of course, investors should conduct a thorough amount of due diligence, to make sure the underlying fundamentals support the dividend.
As always, investors should avoid dividend cuts whenever possible. Any stock that has an abnormally high yield is a potential danger.
Indeed, there are multiple risk factors that investors should know before they invest in BDCs. First and foremost, BDCs are often heavily indebted. This is commonplace across BDCs, as their business model involves borrowing to make investments in other companies. The end result is that BDCs are often significantly leveraged companies.
When the economy is strong and markets are rising, leverage can help amplify positive returns. However, the flip side is that leverage can accelerate losses as well, which can happen in bear markets or recessions.
Another risk to be aware of is interest rates. Since the BDC business model heavily utilizes debt, investors should understand the interest rate environment before investing. For example, rising interest rates can negatively affect BDCs if it causes a spike in borrowing costs.
That said, BDCs may benefit from falling interest rates. In the current climate of low interest rates, many BDCs could see a tailwind.
Lastly, credit risk is an additional consideration for investors. As previously mentioned, BDCs make investments in small to mid-size businesses.
Therefore, the quality of the BDC’s portfolio must be assessed, to make sure the BDC will not experience a high level of defaults within its investment portfolio. This would cause adverse results for the BDC itself, which could negatively impact its ability to maintain distributions to shareholders.
Another unique characteristic of BDCs that investors should know before buying is taxation. BDC dividends are typically not “qualified dividends” for tax purposes, which is generally a more favorable tax rate. Instead, BDC distributions are taxable at the investor’s ordinary income rates, while the BDC’s capital gains and qualified dividend income is taxed at capital gains rates.
After taking all of this into account, investors might decide that BDCs are a good fit for their portfolios. If that is the case, income investors might consider one of the following BDCs.
Tax Considerations Of BDCs
As always, investors should understand the tax implications of various securities before purchasing. Business Development Companies must pay out 90%+ of their income as distributions. In this way, BDCs are very similar to Real Estate Investment Trusts.
Another factor to keep in mind is that approximately 70% to 80% of BDC dividend income is typically derived from ordinary income. As a result, BDCs are widely considered to be good candidates for a tax-advantaged retirement account such as an IRA or 401k.
BDCs pay their distributions as a mix of ordinary income and non-qualified dividends, qualified dividends, return of capital, and capital gains.
Returns of capital reduce your tax basis. Qualified dividends and long-term capital gains are taxed at lower rates, while ordinary income and non-qualified dividends are taxed at your personal income tax bracket rate.
The Top 5 BDCs Today
With all this in mind, here are our top 5 BDCs today, ranked according to their expected annual returns over the next five years.
BDC #5: Horizon Technology Finance (HRZN)
- •5-year expected annual return: 14.1%
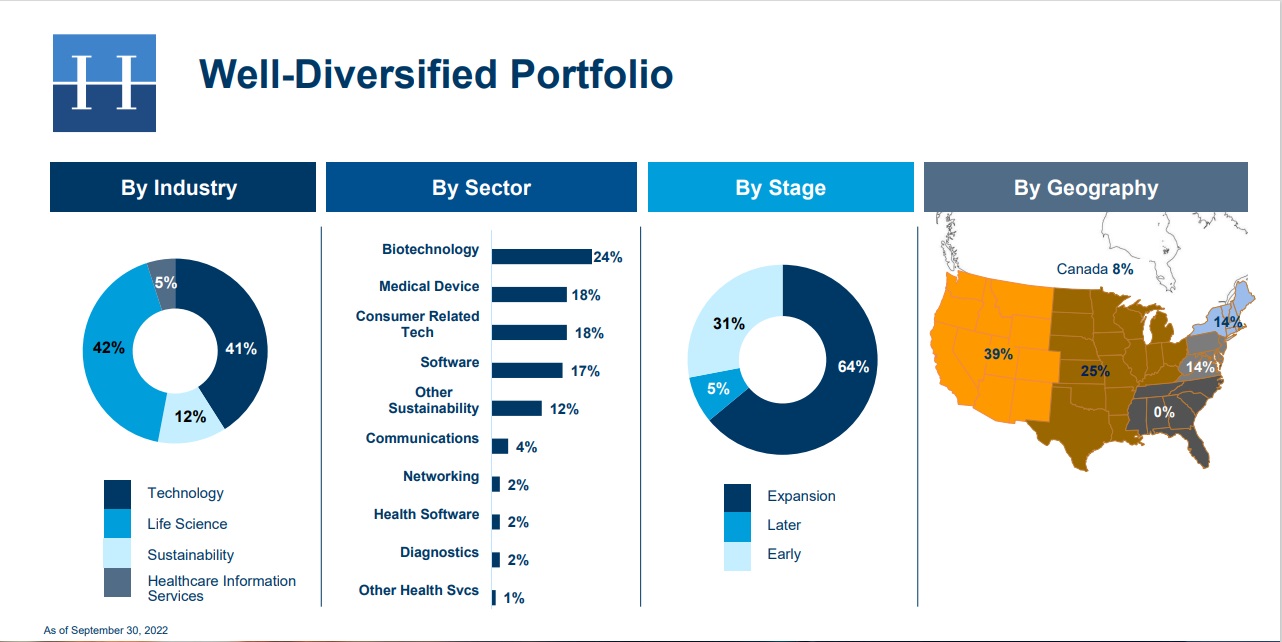
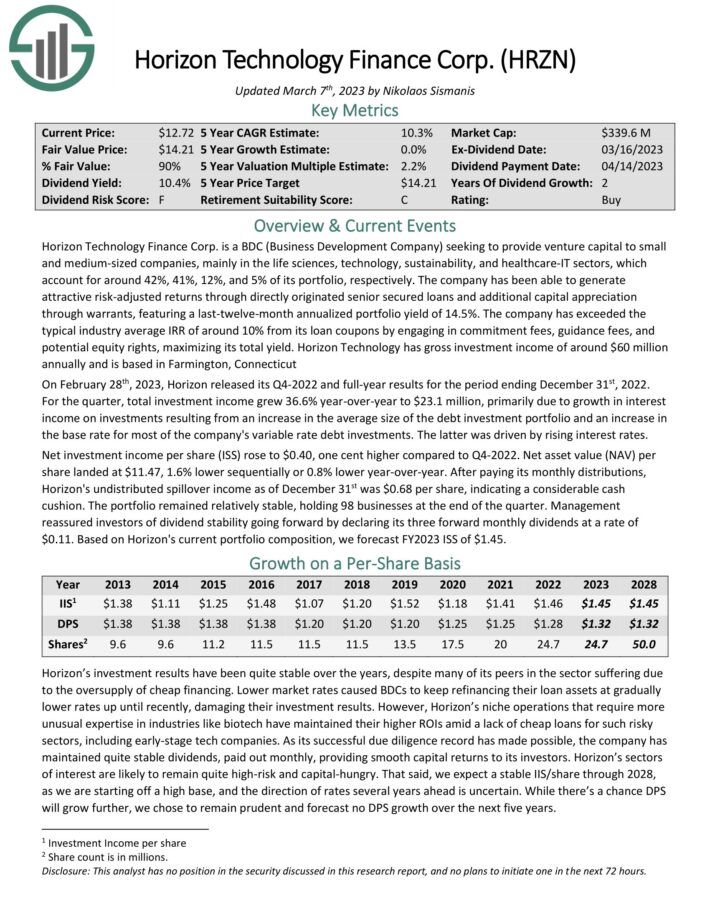
Horizon Technology Finance Corp. is a BDC that provides venture capital to small and medium–sized companies in the technology, life sciences, and healthcare–IT sectors.
The company has generated attractive risk–adjusted returns through directly originated senior secured loans and additional capital appreciation through warrants.
On February 28th, Horizon released its Q4-2022 and full-year results for the period ending December 31st, 2022. For the quarter, total investment income grew 36.6% year-over-year to $23.1 million, primarily due to growth in interest income on investments resulting from an increase in the average size of the debt investment portfolio and an increase in the base rate for most of the company’s variable rate debt investments.
Net investment income per share (ISS) rose to $0.40, one cent higher compared to Q4-2022. Net asset value (NAV) per share landed at $11.47, 1.6% lower sequentially or 0.8% lower year-over-year. After paying its monthly distributions, Horizon’s undistributed spillover income as of December 31st was $0.68 per share, indicating a considerable cash cushion. The portfolio remained relatively stable, holding 98 businesses at the end of the quarter.
Click here to download our most recent Sure Analysis report on HRZN (preview of page 1 of 3 shown below):
BDC #4: Goldman Sachs BDC Inc. (GSBD)
- •5-year expected annual return: 14.6%
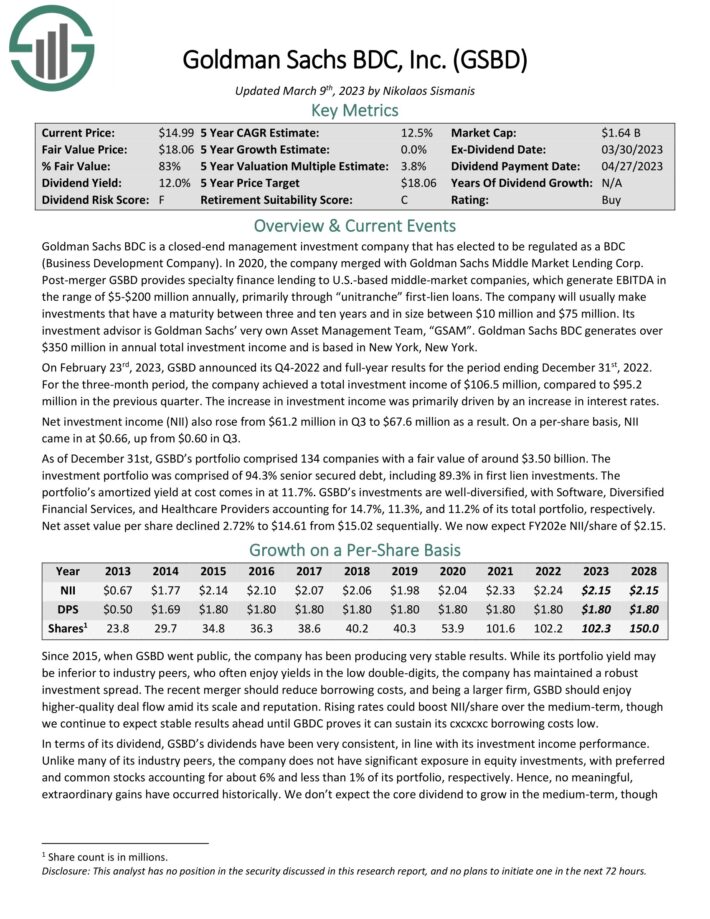
Goldman Sachs BDC provides specialty finance lending to U.S.-based middle-market companies, which generate EBITDA in the range of $5-$200 million annually, primarily through “unitranche” first-lien loans. The company will usually make investments that have a maturity between three and ten years and in size between $10 million and $75 million.
On February 23rd, 2023, GSBD announced its Q4-2022 and full-year results for the period ending December 31st, 2022. For the three-month period, the company achieved a total investment income of $106.5 million, compared to $95.2 million in the previous quarter.
The increase in investment income was primarily driven by an increase in interest rates. Net investment income (NII) also rose from $61.2 million in Q3 to $67.6 million as a result. On a per-share basis, NII came in at $0.66, up from $0.60 in Q3.
As of December 31st, GSBD’s portfolio comprised 134 companies with a fair value of around $3.50 billion. The investment portfolio was comprised of 94.3% senior secured debt, including 89.3% in first lien investments. The portfolio’s amortized yield at cost comes in at 11.7%.
GSBD’s investments are well-diversified, with Software, Diversified Financial Services, and Healthcare Providers accounting for 14.7%, 11.3%, and 11.2% of its total portfolio, respectively. Net asset value per share declined 2.72% to $14.61 from $15.02 sequentially.
Click here to download our most recent Sure Analysis report on GSBD (preview of page 1 of 3 shown below):
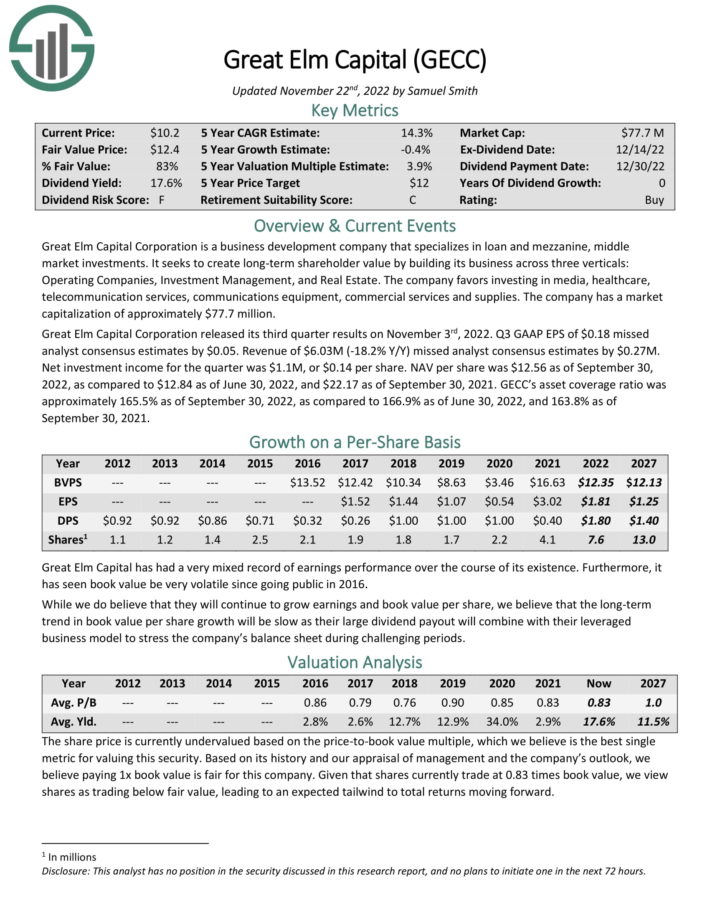
BDC #3: Great Elm Capital Corp. (GECC)
- •5-year expected annual return: 16.0%
Great Elm Capital Corporation is a business development company thatspecializes in loan and mezzanine, middle market investments. It seeks to create long–term shareholder value by building its business across three verticals: Operating Companies, Investment Management, and Real Estate.
The company favors investing in media, healthcare, telecommunication services, communications equipment, commercial services and supplies.
Great Elm Capital Corporation released its third quarter results on November 3rd, 2022.
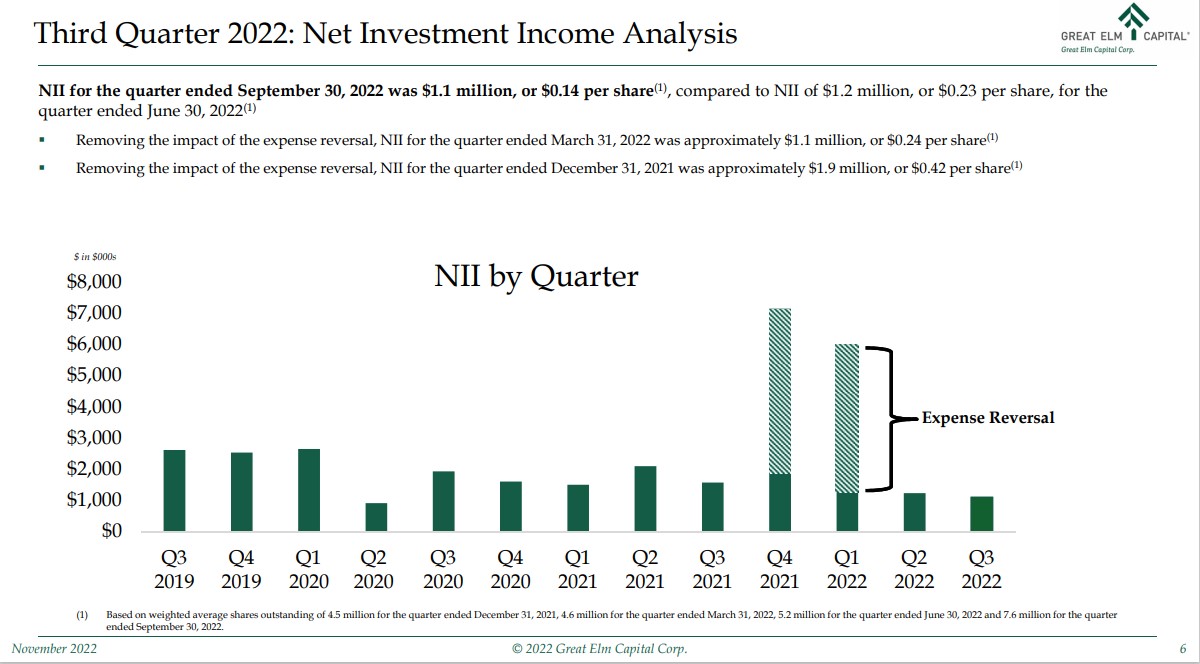
Source: Investor Presentation
Q3 GAAP EPS of $0.18 missed analyst consensus estimates by $0.05. Revenue of $6.03M (-18.2% Y/Y) missed analyst consensus estimates by $0.27M.
Net investment income for the quarter was $1.1M, or $0.14 per share. NAV per share was $12.56 as of September 30, 2022, as compared to $12.84 as of June 30, 2022, and $22.17 as of September 30, 2021. GECC’s asset coverage ratio was approximately 165.5% as of September 30, 2022, as compared to 166.9% as of June 30, 2022.
Click here to download our most recent Sure Analysis report on GECC (preview of page 1 of 3 shown below):
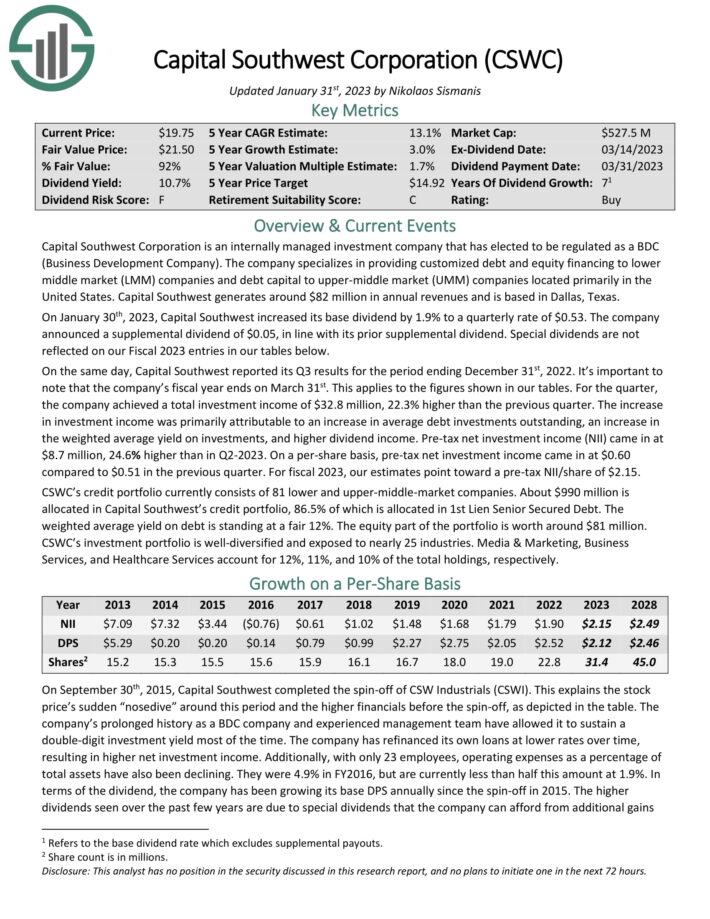
BDC #2: Capital Southwest Corp. (CSWC)
- •5-year expected annual return: 16.2%
Capital Southwest Corporation is an internally managed BDC. The company specializes in providing customized debt and equity financing to lower middle market (LMM) companies and debt capital to upper-middle market (UMM) companies located primarily in the United States.
The company has a long history of paying out regular and supplemental dividends.
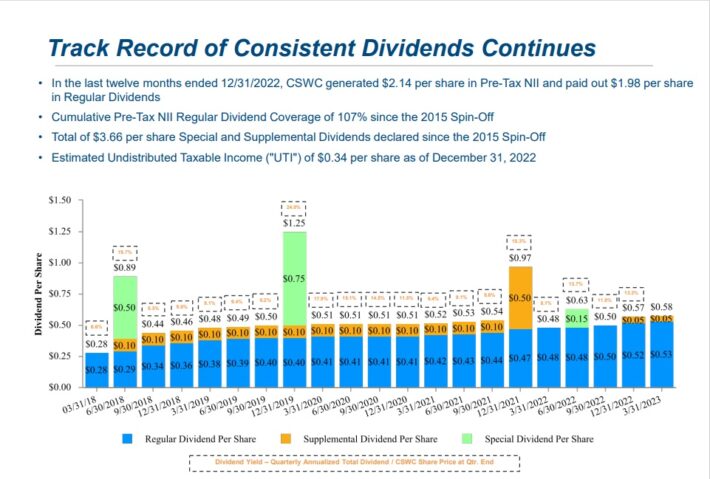
Source: Investor Presentation
On January 30th, 2023, Capital Southwest increased its base dividend by 1.9% to a quarterly rate of $0.53. The company announced a supplemental dividend of $0.05, in line with its prior supplemental dividend. On the same day, Capital Southwest reported its Q3 results for the period ending December 31st, 2022.
For the quarter, the company achieved a total investment income of $32.8 million, 22.3% higher than the previous quarter. The increase in investment income was primarily attributable to an increase in average debt investments outstanding, an increase in the weighted average yield on investments, and higher dividend income. Pre-tax net investment income (NII) came in at $8.7 million, 24.6% higher than in Q2-2023.
On a per-share basis, pre-tax net investment income came in at $0.60 compared to $0.51 in the previous quarter. For fiscal 2023, our estimates point toward a pre-tax NII/share of $2.15.
Click here to download our most recent Sure Analysis report on CSWC (preview of page 1 of 3 shown below):
BDC #1: TriplePoint Venture Growth BDC (TPVG)
- •5-year expected annual return: 16.8%
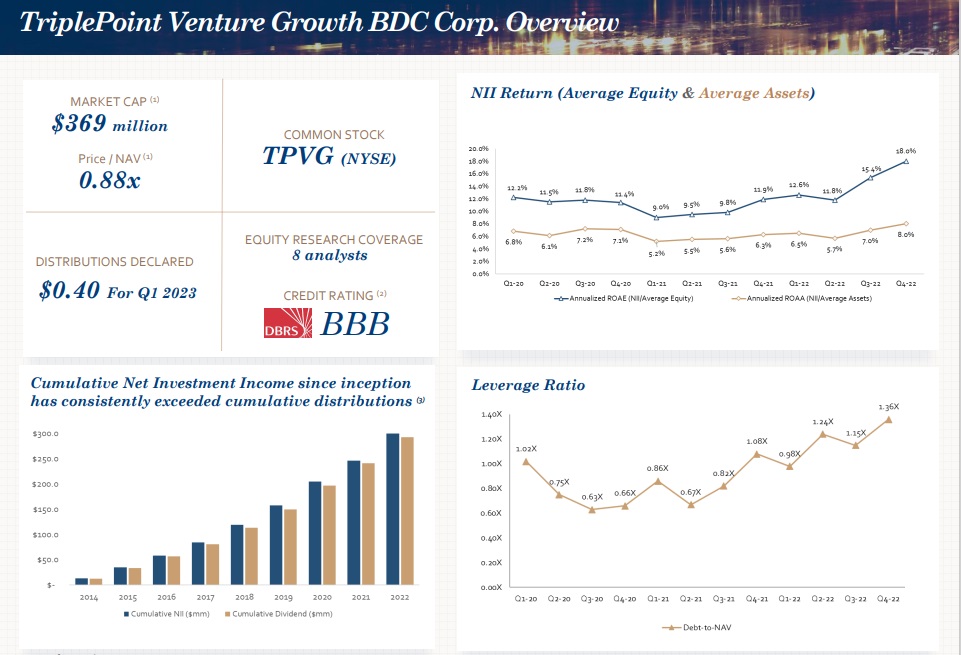
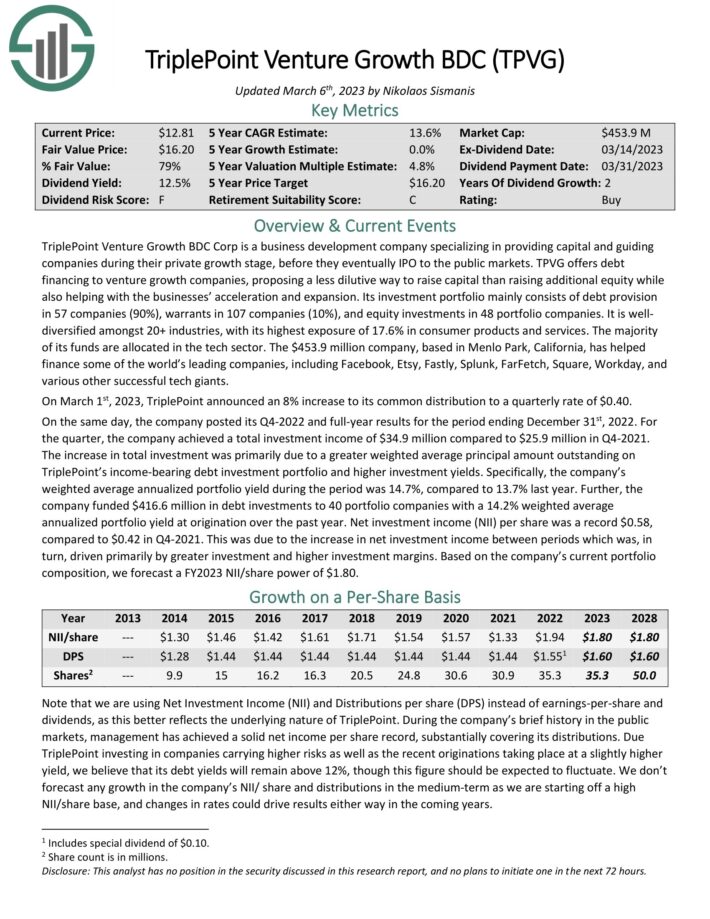
TriplePoint Venture Growth BDC Corp specializes in providing capital and guiding companies during their private growth stage, before they eventually IPO to the public markets.
TPVG offers debt financing to venture growth companies, proposing a less dilutive way to raise capital than raising additional equity while also helping with the businesses’ acceleration and expansion.
Source: Investor Presentation
On March 1st, 2023, TriplePoint announced an 8% increase to its common distribution to a quarterly rate of $0.40. On the same day, the company posted its Q4-2022 and full-year results for the period ending December 31st, 2022. For the quarter, the company achieved a total investment income of $34.9 million compared to $25.9 million in Q4-2021.
The increase in total investment was primarily due to a greater weighted average principal amount outstanding on TriplePoint’s income-bearing debt investment portfolio and higher investment yields.
Specifically, the company’s weighted average annualized portfolio yield during the period was 14.7%, compared to 13.7% last year. Further, the company funded $416.6 million in debt investments to 40 portfolio companies with a 14.2% weighted average annualized portfolio yield at origination over the past year.
Net investment income (NII) per share was a record $0.58, compared to $0.42 in Q4-2021. This was due to the increase in net investment income between periods which was, in turn, driven primarily by greater investment and higher investment margins.
Click here to download our most recent Sure Analysis report on TPVG (preview of page 1 of 3 shown below):
Final Thoughts
Business Development Companies allow everyday retail investors the opportunity to invest indirectly in small and mid-size businesses. Previously, investment in early-stage or developing companies was restricted to accredited investors, through venture capital.
And, BDCs have obvious appeal for income investors. BDCs widely have high dividend yields above 5%, and many BDCs pay dividends every month instead of the more typical quarterly payment schedule.
Of course, investors should consider all of the unique characteristics, including but not limited to the tax implications of BDCs. Investors should also be aware of the risk factors associated with investing in BDCs, such as the use of leverage, interest rate risk, and default risk.
This article was first published by Bob Ciura for Sure Dividend
Sure dividend helps individual investors build high-quality dividend growth portfolios for the long run. The goal is financial freedom through an investment portfolio that pays rising dividend income over time. To this end, Sure Dividend provides a great deal of free information.
Related:


